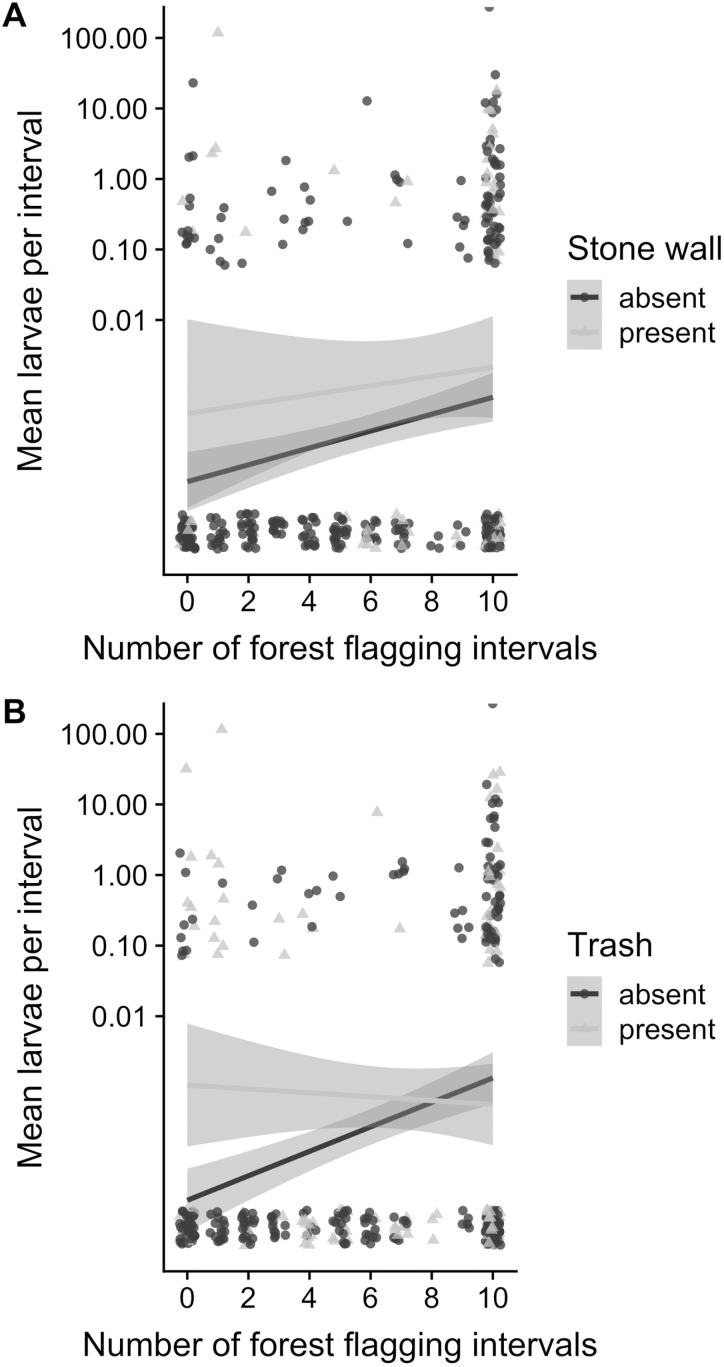
Fig. 1.
Questing larval tick abundance in relation to forest area, and the presence (1, light gray triangles) or absence (0, dark gray circles) of A) stone walls and B) trash in residential yards. Each line is based on a linear model fitted to the data; the gray bounds are 95% confidence intervals for predictions from the fitted model. To plot on log scale for greater ease of interpretation, 0.00001 has been added to each questing larval tick value. The data have been horizontally and vertically ‘jittered’ to reduce overlap of points.

