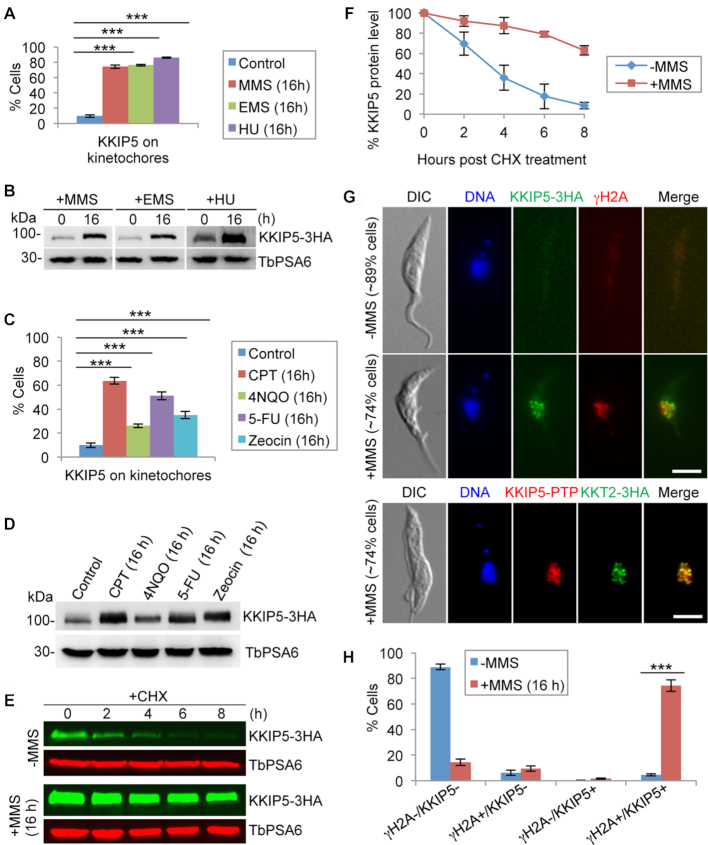
Figure 3.
DNA damage increases KKIP5 protein level through inhibiting KKIP5 degradation. (A) Treatment with DNA damage-inducing agents MMS, EMS and HU increased the population of KKIP5-positive cells. Two hundred cells were counted for each cell sample. Error bars represent S.D. calculated from three independent experiments. ***P < 0.001. (B) KKIP5 protein level increased in response to DNA damage agents. Endogenous KKIP5-3HA was detected by anti-HA mAb, and TbPSA6 was detected by anti-TbPSA6 pAb to serve as a loading control. (C) Treatment with a variety of DNA damage-inducing agents that cause distinct DNA damages increased the population of KKIP5-positive cells. Two hundred cells were counted for each cell sample. Error bars represent S.D. calculated from three independent experiments. **P < 0.01; ***P < 0.001. (D) KKIP5 protein level increased in response to DNA damage agents. Endogenous KKIP5-3HA was detected by anti-HA mAb, and TbPSA6 was detected by anti-TbPSA6 pAb to serve as a loading control. (E) MMS treatment stabilized KKIP5 protein. Shown is the cycloheximide (CHX) chase analysis. KKIP5 was tagged with a triple HA epitope, and detected by anti-HA antibody. TbPSA6 served as a loading control. (F) Quantitation of the KKIP5 protein level in panel E. KKIP5 protein band intensity was normalized with that of TbPSA6 and plotted against time of CHX treatment. Error bars represent S.D. from three independent experiments. (G) Co-immunofluorescence of KKIP5 with phospho-histone H2A (γH2A) and KKT2. KKIP5-3HA was detected by anti-HA mAb, and histone γH2A was detected by anti-γH2A pAb. KKIP5-PTP was detected by anti-Protein A pAb, and KKT2-3HA was detected by anti-HA mAb. Scale bar: 5 μm. (H) Quantitation of γH2A/KKIP5-positive and -negative cells in control and MMS-treated cells. γH2A+, γH2A-positive cells; γH2A-, γH2A-negative cells; KKIP5+, KKIP5-positive cells; KKIP-, KKIP5-negative cells. Two hundred cells were counted for each cell sample. Error bars represent S.D. calculated from three independent experiments. ***P < 0.001.

