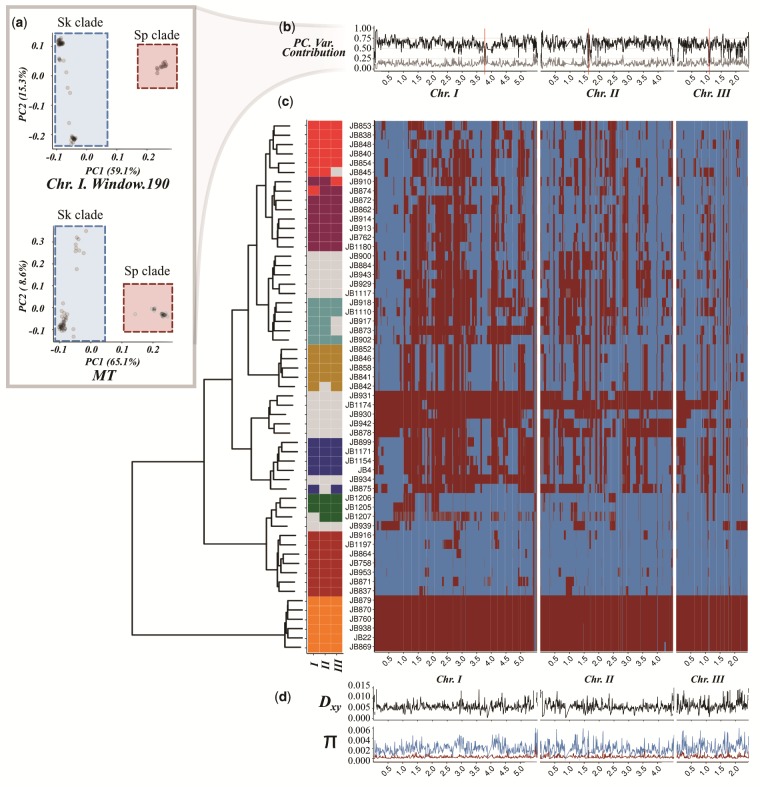
Fig. 1.
Distribution of Sp (red) and Sk (blue) ancestry blocks along the Schizosaccharomyces pombe genome. (a) Example of principal component analysis (PCA) of a representative genomic window in chromosome I (top) and the whole mitochondrial DNA (bottom). Samples fall into two major clades, Sp (red square) and Sk (blue square). The proportion of variance explained by PC1 and PC2 is indicated on the axis labels. Additional examples are found in supplementary figure 1 (Supplementary Material online). (b) Proportion of variance explained by PC1 (black line) and PC2 (gray line) for each genomic window along the genome. Centromeres are indicated with red bars. Note the drop in proximity to centromeres and telomeres where genotype quality is significantly reduced. (c) Heatmap for one representative of 57 near-clonal groups indicating ancestry along the genome (right panel). Samples are organized according to a hierarchical clustering, grouping samples based on ancestral block distribution (left dendrogram). Colors on the tips of the cladogram represent cluster membership by chromosome (see supplementary fig. 9, Supplementary Material online). Samples changing clustering group between chromosomes are shown in gray. (d) Estimate of Dxy between ancestral groups and genetic diversity (π) within the Sp (red) and Sk clade (blue) along the genome.

