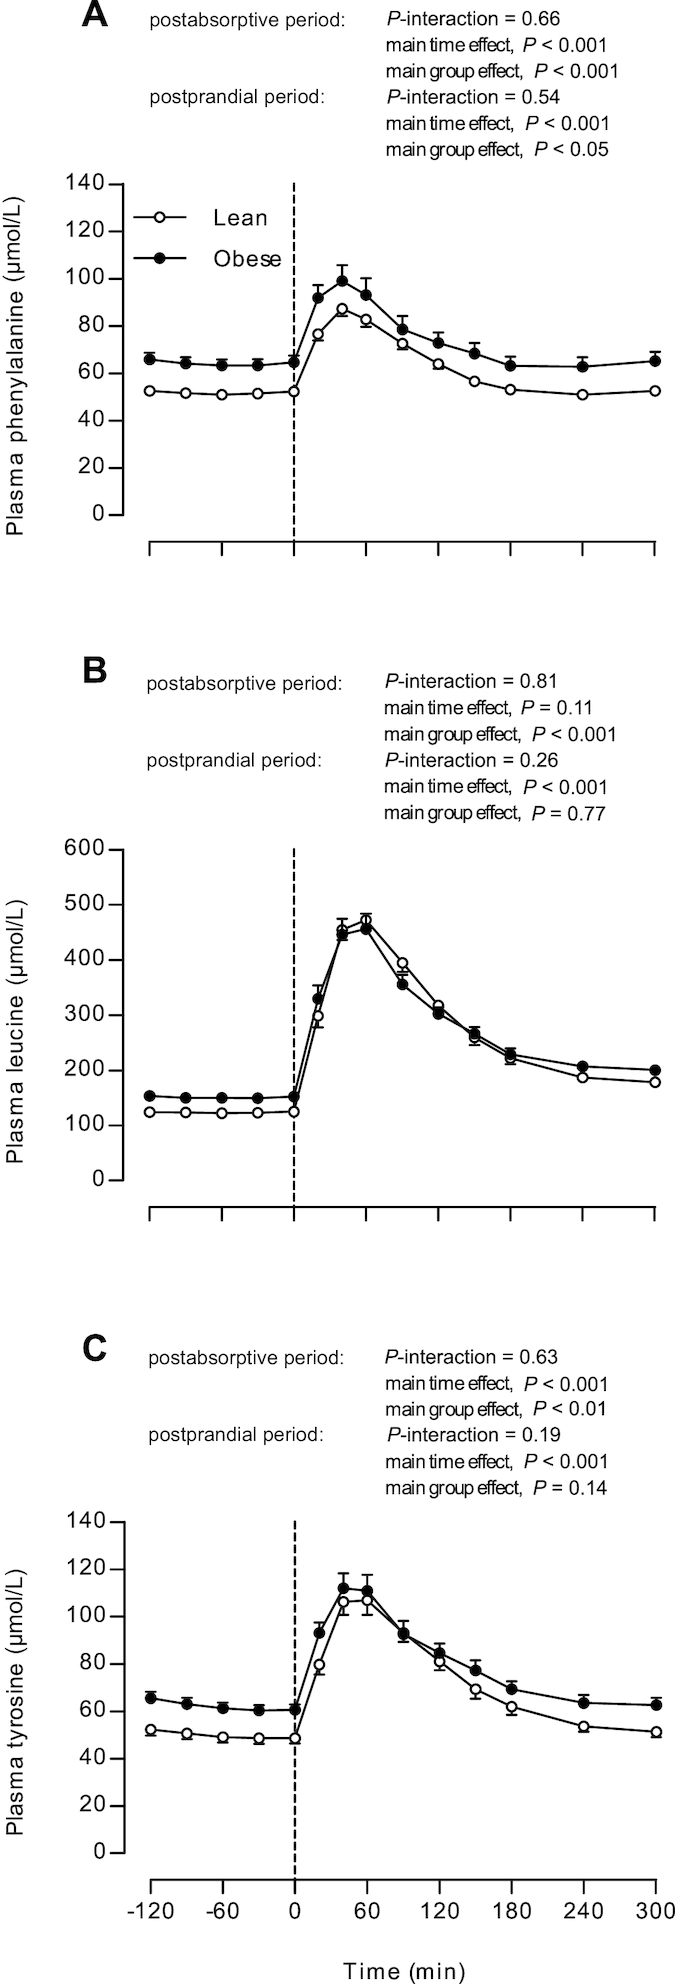
FIGURE 2.

Plasma phenylalanine (A), leucine (B), and tyrosine (C) concentrations in lean and obese middle-aged men under postabsorptive conditions and after the ingestion of 25 g whey protein. Values are means ± SEMs, n = 12/group. The dotted line represents the ingestion of the protein beverage. Data were analyzed with repeated-measures (time × group) ANOVA.
