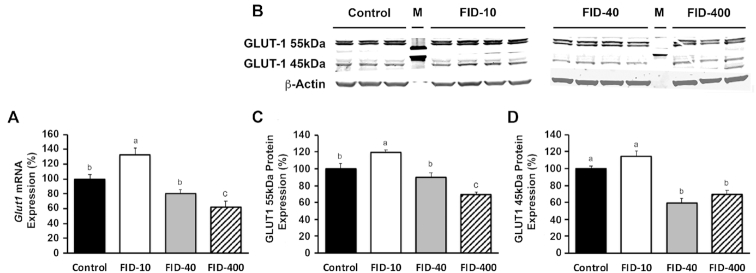
FIGURE 2.
Glut1 mRNA and GLUT1 protein expression in the hippocampus of control and FID adult rats in Study 1. (A) Quantification of Glut1 mRNA expression. (B) Representative Western blots of GLUT1 protein. (C) Quantification of the GLUT1 55-kDa protein isoform relative to β-actin. (D) Quantification of the GLUT1 45-kDa protein isoform relative to β-actin. Values are mean ± SEM percentage. Changes in mRNA expression (A) or protein expression (C, D) relative to the control group, n = 8 for transcript and n = 3–4 for protein expression. Dietary groups without a common letter differ, P < 0.05. FID, formerly iron deficient; GLUT1, glucose transporter-1; M, reference protein marker.

