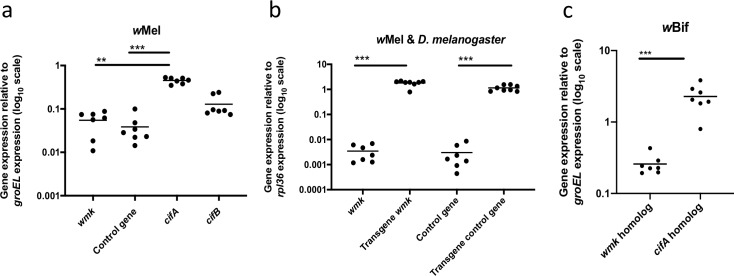
Fig 6. Native Wolbachia gene and transgene expression in embryos of D. melanogaster and D. bifasciata.
(A) Graph of native prophage WO and Wolbachia gene expression in wMel-infected D. melanogaster embryos fixed 4–5 h AED (pooled male & female) compared to Wolbachia groEL. Each point (n = 7) represents a pool of 30 embryos from a set of 10 mothers and 2 fathers. (B) Graph of (i) transgene expression in uninfected D. melanogaster embryos fixed 4–5 h AED versus (ii) native gene expression in samples from a, both compared to Drosophila rpl36 (pooled male, female, expressing, and non-expressing for transgenes). Each point (transgene n = 8, native n = 7) represents a pool of 30 embryos from a set of 10 mothers and 2 fathers. (C) Graph of wBif Wolbachia gene expression in D. bifasciata embryos 4–5 h AED (pooled male & female) compared to Wolbachia groEL. Homologs to the control gene in this study and cifB were not measured as they are not present in the wBif genome assembly. Each point (n = 7) represents a pool of 30 embryos from a set of 10 mothers and 2 fathers. Values denote 2-ΔCt. Statistics are based on a Kruskal-Wallis one-way ANOVA followed by Dunn’s correction. This experiment has been done once. **p<0.01, ***p<0.001.

