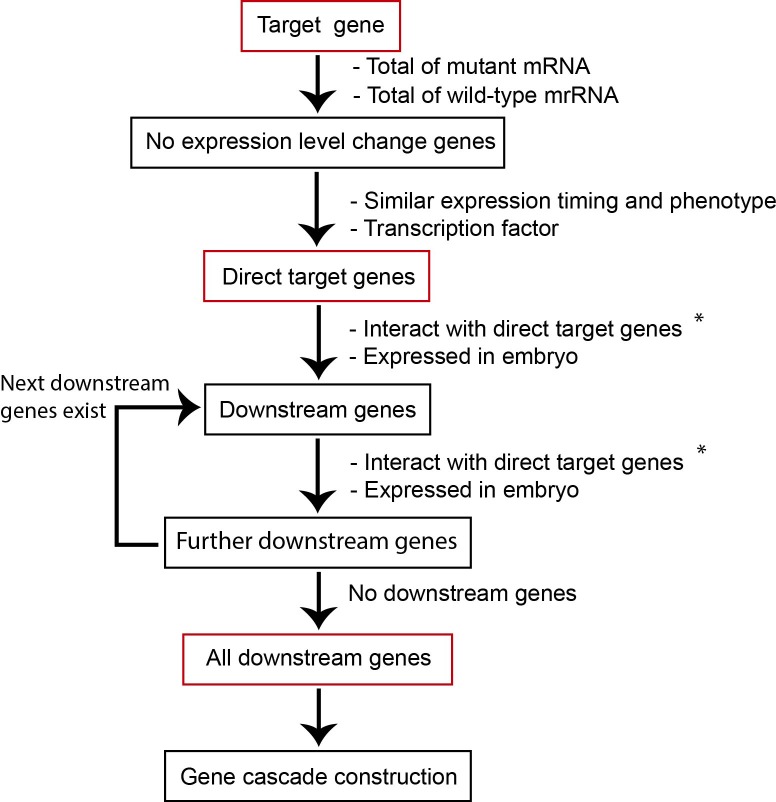
Fig 1. Schematic for prediction of the gene cascade.
Application protocol for GCF. Genes in the predicted cascade are indicated by red frames. To identify the entire gene network, we repeatedly identified the downstream genes. The genes surrounded by black frames were required to identify the genes surrounded by red fames. The information of the labels with asterisks was extracted from WormBase.

