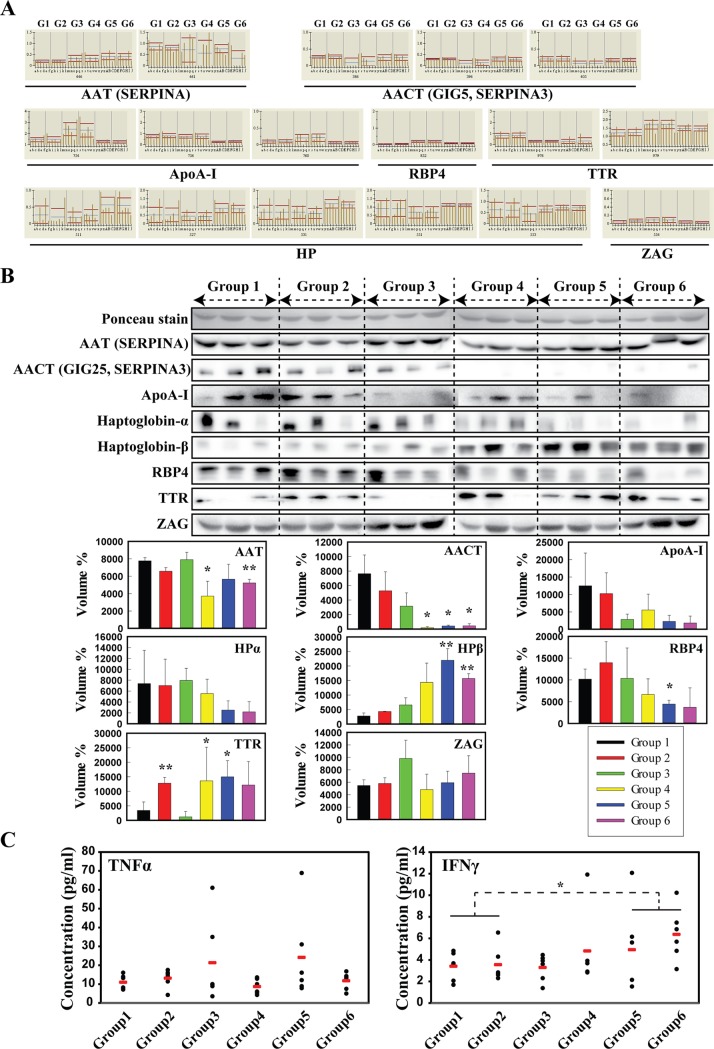
Fig 2. Differentially regulated proteins in the serum of patients with prediabetes/diabetes compared with healthy donors.
(A) Normalized graphs of 2-DE spots showing relative upward/downward trends in regulation (G1–G6 indicate patient groups), (B) validation of target proteins linked to abdominal obesity and diabetes. Significant differences among groups (where, each Group was compared to Group 1) were determined by ANOVA, *p < 0.05 or **p < 0.01. (C) Expression levels of pro-inflammatory cytokine genes, TNFα and IFNγ in serum of patients with prediabetes/diabetes compared with healthy donors. Significant differences between normal (Groups 1 and 2) and prediabetes (Groups 3 and 4)/diabetes (Groups 5 and 6) groups were determined by ANOVA; *p < 0.05.

