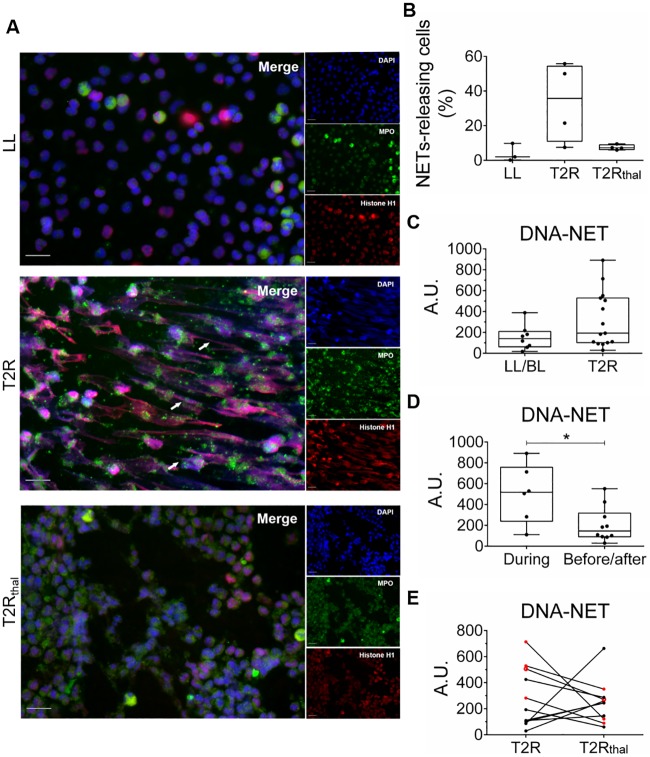
Fig 3. T2R neutrophils show spontaneous ex vivo NETs production, which decreases with thalidomide treatment.
Neutrophils from LL/BL, T2R, and T2Rthal patients were isolated and incubated in medium alone for 90 min. (A) Immunostaining of NETs components (MPO, green; histone, red; and DNA, blue). Arrows indicate the presence of NETs. Images are representative of 3 LL/BL, 4 T2R and 4 T2Rthal. Scale bar: 20 μm. (B) The percentage of NETs-releasing cells from 5 fields captured from 3 LL/BL, 4 T2R and 4 T2Rthal patients is shown. (C) Neutrophils from LL/BL, T2R, and T2Rthal patients were incubated for 90 min and DNA release was measured by picogreen. Box plots show median, interquartile range, sample minimum, and maximum. Each dot represents a donor. (D) Comparison of patients who developed T2R during MDT versus those with reactional episodes before or after MDT. (E) Follow-up of DNA levels released after 7 days of thalidomide treatment. Dots in red are patients who developed T2R during MDT. *P<0.05 (Mann Whitney test).

