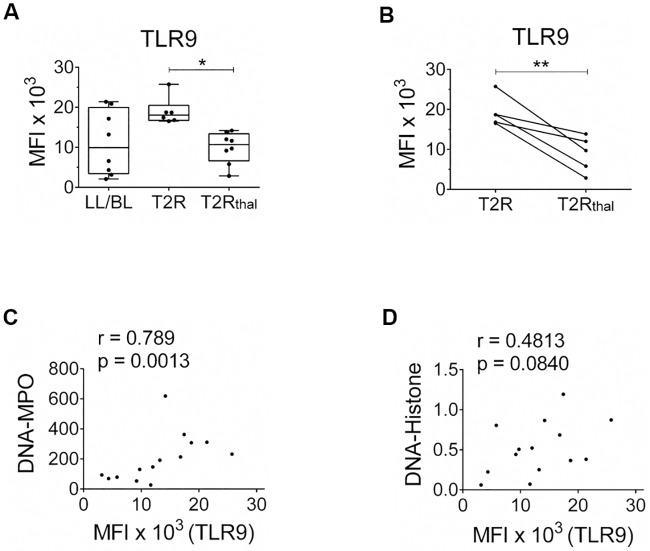
Fig 6. T2R patient neutrophils express higher levels of TLR9, which decrease after thalidomide treatment.
(A) Neutrophils of LL/BL, T2R and T2Rthal patients were isolated and ex vivo TLR9 expression levels were quantified by flow cytometry. *P<0.05 (Kruskal-Wallis test). (B) Follow-up of TLR9 expression in T2R patients after 7 days of thalidomide treatment. Box plots show median, interquartile range, sample minimum, and maximum. Each dot represents a donor. **P<0.01 (Wilcoxon test). (C) Spearman’s correlation between DNA-MPO complex and TLR9 expression per patient (n = 14, r = 0.789, P = 0.0013). (D) Spearman’s correlation between DNA-histone complex and TLR9 expression per patient (n = 14, r = 0.4813, P = 0.0840).

