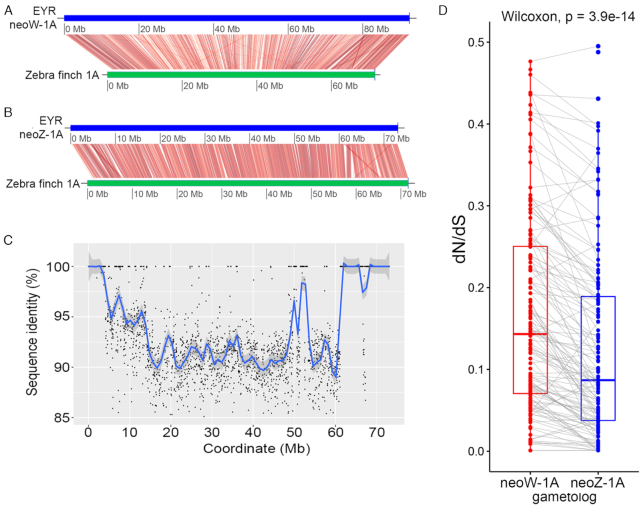
Figure 5:
Characterization of the inferred neo-sex chromosomes in eastern yellow robin. Linear genome comparison of the (A) neoW-1A and (B) neoZ-1A pseudomolecules (blue horizontal bars) with the zebra finch chromosome 1A (green horizontal bars). The neoW-1A alignment is ∼20 Mb longer than that of neoZ-1A. The red lines denote regions of nucleotide similarity with >70% nucleotide identity calculated over a 10-kb non-overlapping sliding window. (C) Pairwise sequence identity per 10-kb sliding window (to obtain high resolution) between the neoW-1A and neoZ-1A scaffolds mapped along the neoZ-1A pseudomolecule, with coordinates relating to the neoZ-1A pseudomolecule. Zones of different levels of sequence similarity can be seen along the pseudomolecule. The blue line denotes the smoothed conditional means for pairwise identity and the grey zone around it indicates the 95% confidence interval. (D) Paired box plots showing the dN/dS ratios of neoW-1A and neoZ-1A gene copies (gametologs) of the eastern yellow robin compared with collared flycatcher orthologs as references. Collared flycatcher was used here in preference to zebra finch because the former has greater protein similarity to EYR. Each dot represents a gene and grey lines connecting red and blue dots represent gametologs.

