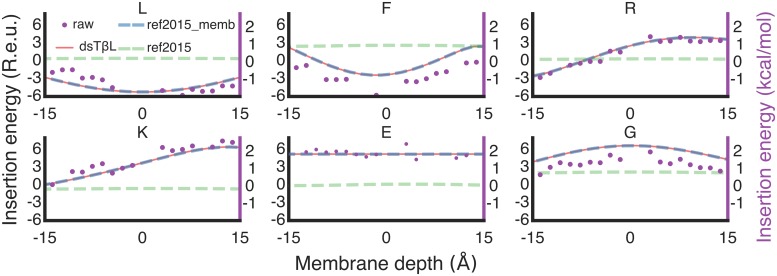
Fig 1. The lipophilicity-based ref2015_memb energy function.
Membrane-insertion profiles for six representative amino acids are shown. Raw dsTβL data (purple dots), ref2015 (dashed green line), the ref2015_memb potential (dashed blue line) and the dsTβL profiles (red line). Negative and positive membrane depths indicate the inner and outer membrane leaflets, respectively; the presumed membrane midplane is at 0.

