
Figure 2.
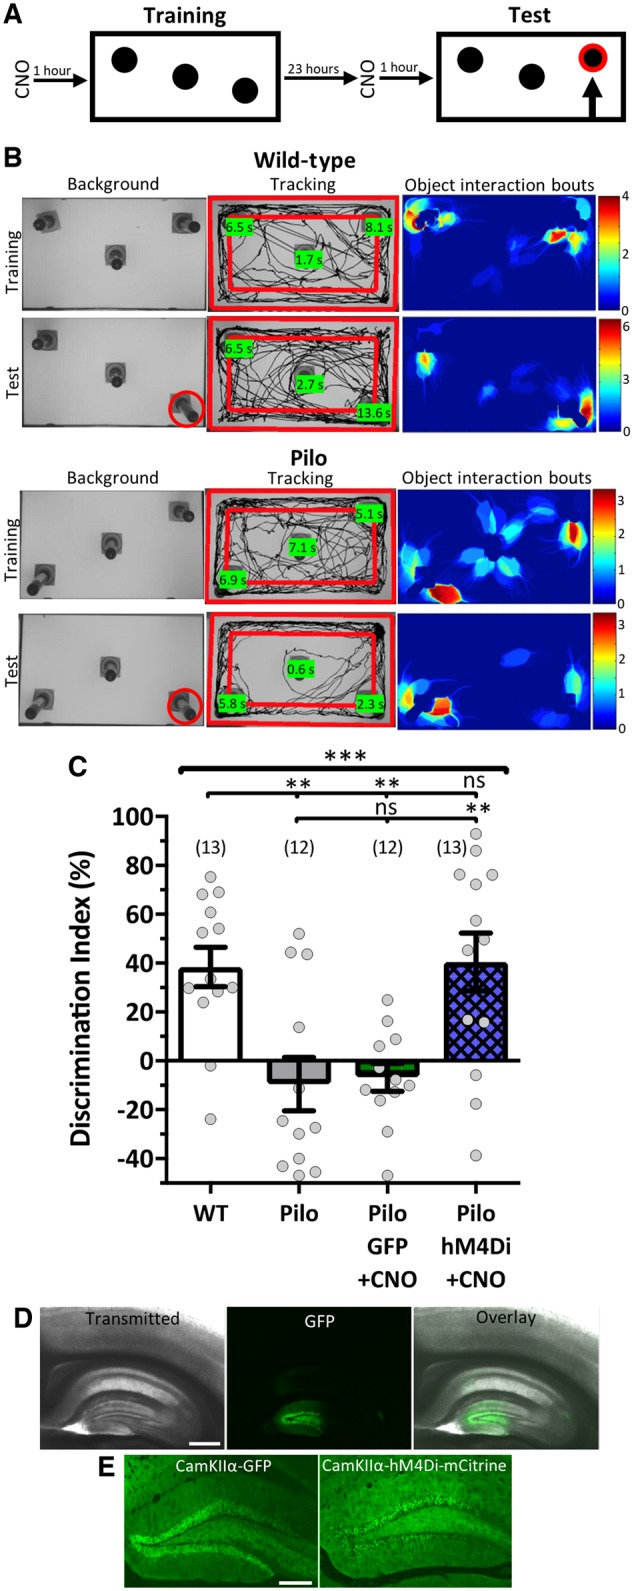
Reducing DGC hyperactivity via inhibitory DREADDs rescues performance. (A) Schematic of SOR task. (B) Representative images of SOR exploration for a wild-type (top) and a pilocarpine (bottom) mouse during their third training trial and their test trial. Background images show the object configuration with the displaced object marked in red for the test trial. Tracking images show the mouse’s total exploration during the trial with the total interaction time with each object quantified in the green boxes. The object interaction bouts images are heat maps of the cumulative time (s) the animal spent in each location when it was interacting with an object. The wild-type mouse shows an increased preference for the displaced object during its test trial while the Pilo mouse does not. (C) Quantified SOR performance showing that hM4Di recruitment rescues discrimination performance in epileptic mice [F(3,46) = 8.388, P = 0.0001, one-way ANOVA with Tukey’s multiple comparisons correction]. CNO = 1.5 mg/kg. (D and E) Representative confocal micrographs of the fluorescent reporter co-expressing with the viral vectors. (D) Micrographs (4×) showing viral expression was localized to the dentate gyrus. Scale bar = 500 µm. (E) Micrographs (10×) of reporter for the CamKIIα-GFP (left) and CamKIIα-hM4Di (right). Scale bar = 200 µm. Data are represented as mean ± SEM. Each circle represents an animal (number of animals indicated in parentheses). nsP > 0.05, *P < 0.05, **P < 0.01, ***P < 0.001.