Figure 6.
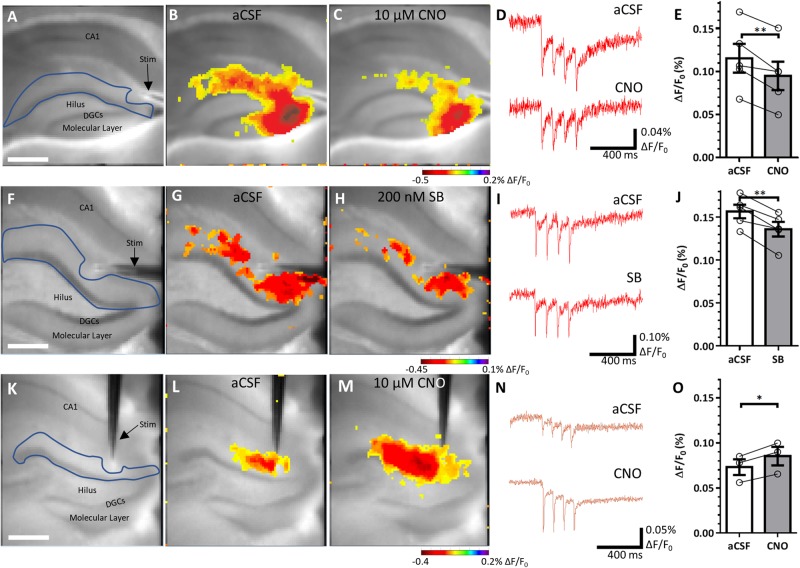
Voltage sensitive dye imaging confirms DREADD-mediated changes in activity. (A) Representative micrograph from the CCD camera of the recording setup and analysis region of interest in blue. Scale bar = 425 µm. (B and C) Per cent ΔF/F0 maximal response of the hM4Di-expressing epileptic slice in artificial CSF (aCSF) (B) and in 10 µM CNO (C). (D) Representative traces of ΔF/F0 (%) in artificial CSF and CNO. (E) Quantified ΔF/F0 (%) in aCSF and in CNO [t(4) = 4.768, P = 0.009]. F–J are comparable to A–E, examining KORD effects in epileptic tissue. (J) Quantified ΔF/F0 (%) in artificial CSF and in 200 nM SB [t(4) = 6.186, P = 0.004]. K–O are comparable to A–E, examining hM3Dq effects in control tissue. (O) Quantified ΔF/F0 (%) in artificial CSF and in 10 µM CNO [t(2) = 7.652, P = 0.017]. Statistical comparisons are two-tailed paired t-tests. Data are represented as mean ± SEM. Each circle represents an animal (each circle indicates the mean of two to three slices for a given animal). *P < 0.05, **P < 0.01.

