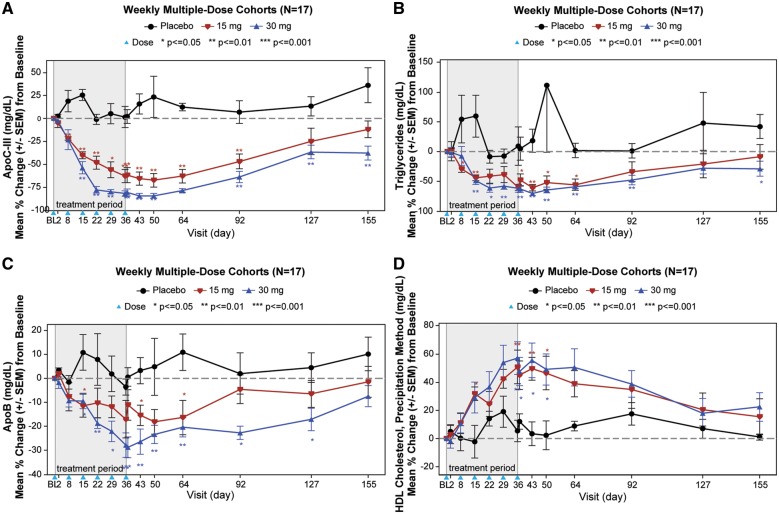
Figure 2.
Multiple ascending dose cohorts. The graphs display the mean percent change (±SEM) in apoC-III (A), triglycerides (B), apoB (C), and HDL-C (D) in the multiple dose cohorts. The blue arrowhead represents the timing of the doses. The data were compared between AKCEA-APOCIII-LRx treatments and placebo using one-way analysis of variance or Wilcoxon rank sum test. Subjects were required to have a fasting triglyceride level ≥200 mg/dL.

