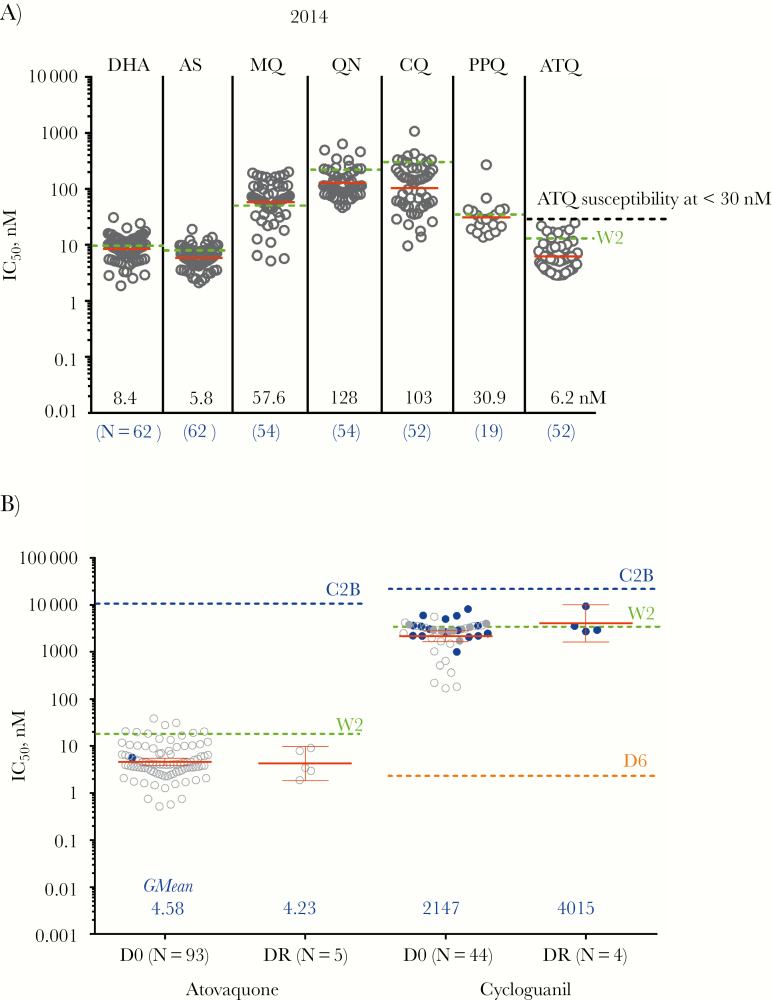
Figure 4.
Immediate ex vivo Plasmodium falciparum (P.f.) parasite resistance. A, Overall ex vivo P.f. parasite sensitivity to commonly used antimalarial drugs in 2014 from field surveillance stations in Cambodia. Red bars represent geometric mean values, whereas green dashed lines represent values for the W2 Indochina P.f. clone. B. Ex vivo parasite sensitivity by histidine-rich protein 2 enzyme-linked immunosorbent assay to atovaquone and cycloguanil for evaluable isolates on the day of study screening before treatment (D0) and day of recrudescence (DR). Baseline assays were interpretable for only 93 of 202 isolates for atovaquone (46%) and 46 of 160 (29%) for cycloguanil. Clear dots represent parasites with the cytb atovaquone resistance gene wild-type, and blue dots represent K13 propeller status unknown. Red bars in each column represent geometric mean 50% inhibitory concentration (IC50) values, whereas dashed green lines represent mean values for the chloroquine-resistant W2 Indochina clone run simultaneously for each assay. Dashed blue lines represent geometric mean values for the atovaquone-resistant C2B clone. Dashed orange lines represent geometric mean values for the chloroquine-sensitive D6 clone. Geometric mean atovaquone IC50 for parasites with the C580Y mutation was significantly higher (4.57 nM; n = 94) than for non-C580Y parasites (1.29 nM; n = 4; P = .001).

