Figure 1.
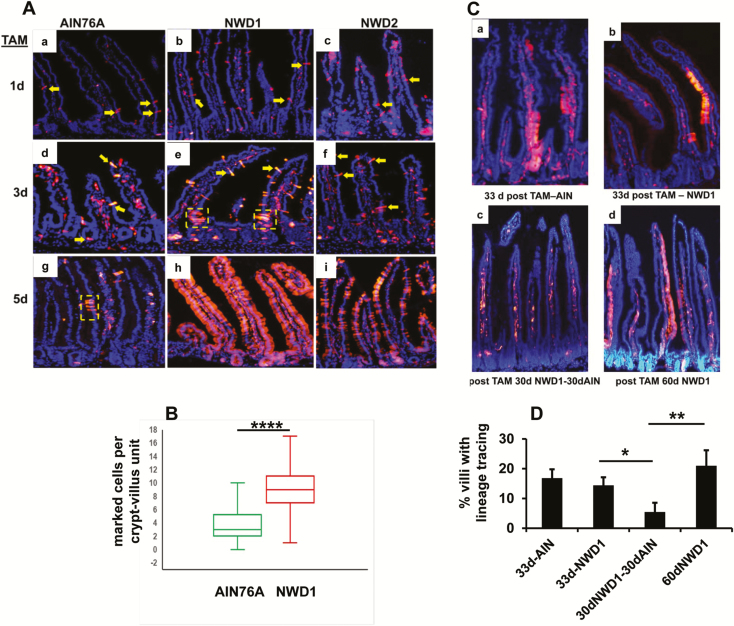
Mobilization and persistence of Bmi1+ cells in mice fed different diets. (A) Red fluorescent intestinal epithelial cells derived from Bmi1+ cells in Bmi1creERT2, Rosa26tom mice fed different diets from weaning for 3 months, and injected with TAM 1, 3 or 5 days before sacrifice. Yellow arrows: examples of marked epithelial cells; yellow dotted boxes: examples of lineage tracing from BmicreERT2 marked cells. (B) Quantification of the number of marked Bmi1+ epithelial cells per crypt-villus in mice fed AIN76A or NWD1 from weaning for 3 months, and sacrificed 3 days following TAM injection: n = 77 and 67 crypt-villi scored for marked epithelial cells for mice fed AIN76A and NWD1 diets, respectively, for random fields of three mice in each dietary group. ****P = 5 × 10⁻¹⁵, Student’s t-test. (Ca, b) mice were fed AIN76A or NWD1 diet from weaning, injected with TAM at 3 months, and each mouse continued on its respective diet for an additional 33 days. (Cc, d) mice fed NWD1 from weaning, injected with TAM at 3 months, continued on NWD1 for 30 additional days and then switched to AIN76A for an additional 30 days (Cc) or continued on NWD1 for an additional 30 days (Cd). (D) Quantification of the % villi under each condition that exhibit lineage tracing of the Bmi1creERT2 marked cells. *P = 0.06; **P = 0.015, Student’s t-test.

