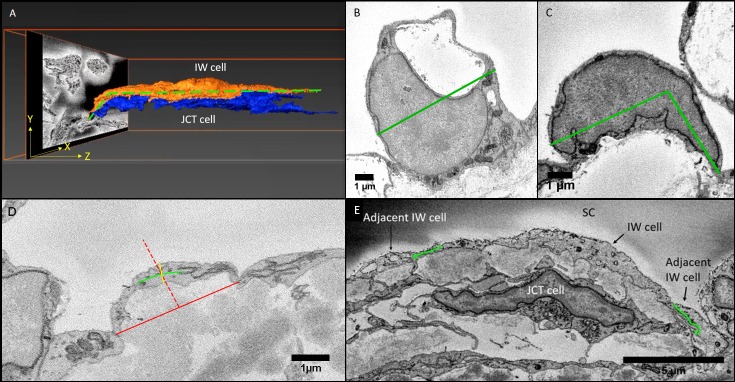
Figure 1.
Methods for measurements in Reconstruct and ImageJ. (A) A schematic of measurement of IW cell length in 3D scene of Reconstruct software. The cell length (green dotted line) of the IW endothelial cell of SC was measured along its major axis in the Z-dimension using the “Z-trace” tool to autocalculate the cell length. (B, C) Cell width in nuclear area: The cell width was measured on the section where its nucleus was largest in size. When the base of the cell was flat, cell width was defined as the maximum possible width across the cell body (green straight line) that parallels the base of the inner wall endothelium (B). When the cell curved, a maximum of three marks were made along the cell axis to connect the borders of the cell (green line), accounting for the cell's curvature (C). (D) Cell thickness: The cell thickness was measured on multiple images where neither nucleus or GVs were observed. The central part of the cell was identified by a perpendicular red dotted line drawn at the halfway point of a red solid line connecting the two cell borders. Then, a green solid line was drawn through the axis of the cell, intersecting the red dotted line. Finally, a yellow solid line perpendicular to the green axis line was drawn to measure cell thickness, crossing the intersection of the axis line and red dotted line. (E) Cell overlap length (OL): The measurement for the OL was made by drawing a curved line (green) along the cell border that lapped with the other cell border. The OL measurement was done on both borders of a cell to calculate for a mean OL value for each cell. (B–D: measurements were made on SBF-SEM images using ImageJ).

