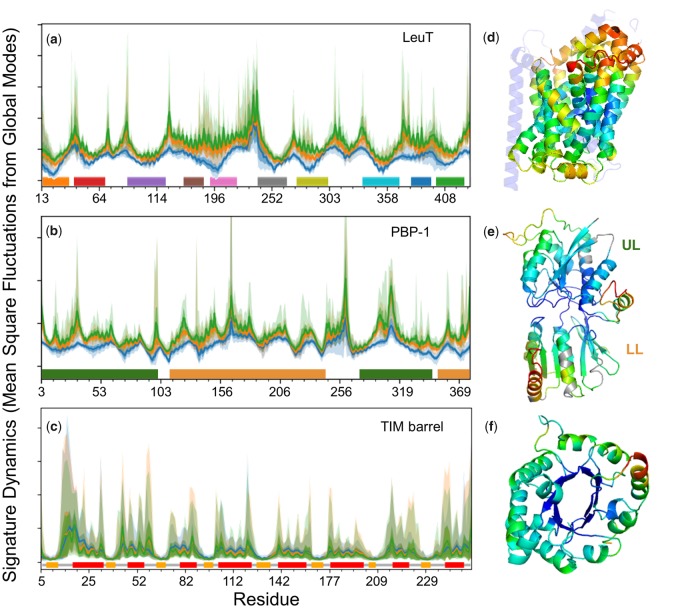
Fig. 2.
Signature dynamics of each family is robustly defined by global motions uniquely defined by the fold. Panels (a–c) display the distributions of mean-square fluctuations (MSFs) of residues for the respective fold families LeuT, PBP-1, and TIM barrel. Mobility profiles driven by k = 3 (blue), 10 (orange), and 20 (green) modes are presented, along with their SDs and ranges (bands in lighter shades). Horizontal bars along the abscissa indicate 1) the transmembrane (TM) helices of LeuT, 2) the upper lobe (UL) and lower lobe (LL) of PBP-1, and 3) the secondary structure (orange, β-strands; red, α-helices) of TIM barrel. Residue numbers along the abscissa refer to those retained in the ensemble (i.e., sequence positions whose occupancy in the MSA is 0.7 or higher), and deletions are not explicitly shown. (d–f) Ribbon diagrams of representative members, with core residues color-coded by their mobilities in global modes (1 ≤ k ≤ 3; blue, minimal; red, maximal).

