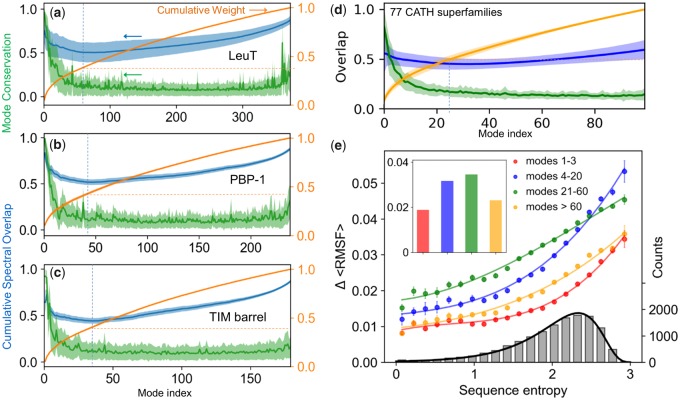
Fig. 3.
Mode conservation and spectral overlap analysis shows the high conservation of global modes and differentiation of LTIF modes among (super)family members. (a–c) Mode conservation profile given by mode–mode correlation cosines averaged over all family members (green), cumulative spectral overlaps (blue), and cumulative weights of individual modes (orange) plotted as a function of mode index for LeuT, PBP-1, and TIM barrel folds, respectively. The curves display the averages over all members in each family and the bands show the SDs. In all three cases, the mode conservation decreases sharply from 0.96 ± 0.03 for mode 1, to 0.63 ± 0.23 for mode 5, and 0.18 ± 0.15 for mode 30. Dashed vertical blue lines indicate the region where the cumulative spectral overlap is minimal, and dashed orange horizontal lines indicate the corresponding cumulative weight. (d) Same result for first 100 modes obtained for 77 CATH superfamilies with N > 100 (see supplementary table S4, Supplementary Material online). The range 1 ≤ k ≤ 100 covers four regimes of motions: global/softest (k ≤ 3), LF (4 ≤ k ≤ 20), LTIF (21 ≤ k ≤ 60), and HF (k ≥ 60). (e) Change in root-mean-square fluctuations, ΔRMSF, computed for all residues in each of the 77 CATH superfamilies as a function of sequence variations (sequence entropy) evaluated for four frequency regimes (labeled). The corresponding average values are shown by colored bars in the inset. The colored curves are weighted least square fits to computed data using cubic regression, with respective correlation coefficients >0.99. The distribution of sequence entropy for the 77 superfamilies, shown by the gray bars (right ordinate) with a bin size of 0.15 and an average value is 2.0, fits a lognormal probability distribution (black curve) with a correlation coefficient of 0.997.

