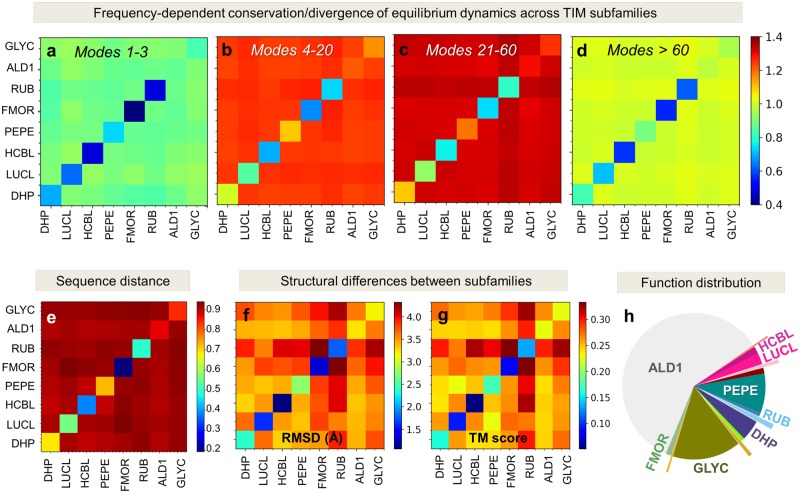
Fig. 4.
Low-to-intermediate frequency modes discriminate between subfamilies with different functions belonging to the TIM barrel fold family. (a–d) Subfamily–subfamily distance matrices based on structural dynamics, evaluated for eight TIM subfamilies. Subfamily acronyms are listed along the axes (see full names in supplementary table S3, Supplementary Material online, and their distribution in supplementary fig. S1c, Supplementary Material online). Spectral distances averaged over all mp and ms members of respective subfamilies (see supplementary methods, Supplementary Material online) are shown by color-coded elements (red: long; blue: short; see the bar on the right). Results are displayed for four frequency regimes, global, LF, LTIF, and HF, in the respective panels (a–d), as indicated by the ranges i ≤ mode ≤ j. Diagonal terms show the average distances between members within subfamilies based on the motions in the particular frequency window; and the off-diagonal terms show those across subfamilies. The LTIF regime (modes 21–60) provides the sharpest discrimination between subfamilies; whereas modes in both the global (a) and HF (d) regimes are relatively conserved. For comparison, we present the sequence distances (e) and structural distances (f and g, using RMSD and TM-score as metrics) between subfamilies. Note that the subfamily–subfamily spectral distances in the LTIF regime (panel c) conform closely to their functional classification (panel h) defined by CATH, rather than their structural similarities (panels f and g), in strong support of the significance of LTIF motions in the evolution of function.

