Fig. 7.
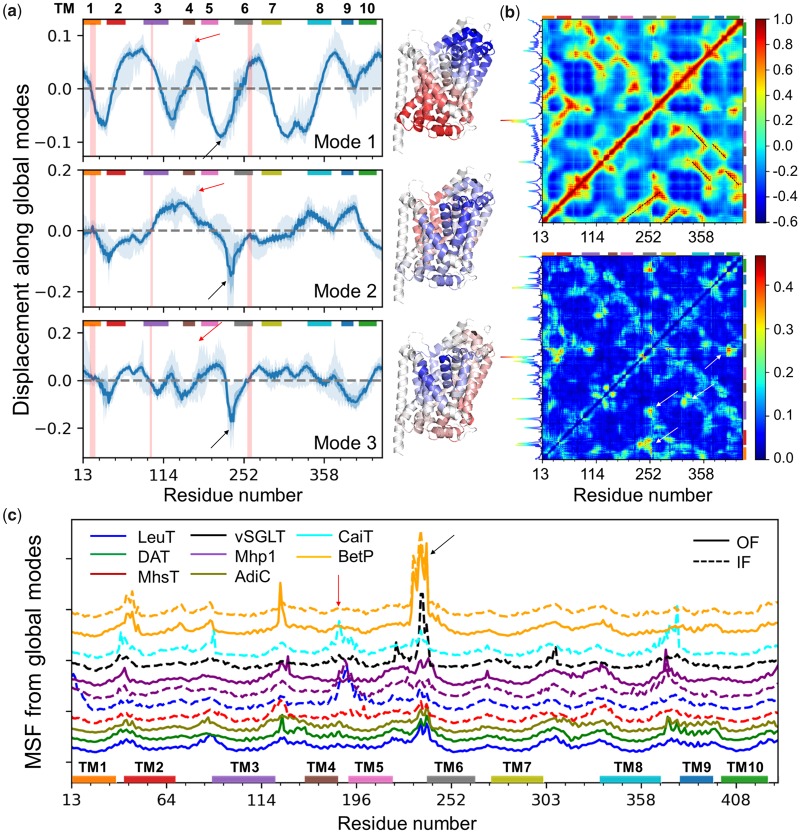
Generic and specific features of LeuT fold dynamics. (a) Global mode shapes and displacements along the global modes shared by family members (mean profiles, solid curves), and their differentiation (SDs; darker shaded area), and the full range of variations (lighter shaded area). Colored bars along the upper abscissa indicate the TM domains. Pink vertical bands indicate the residues lining the substrate-binding pocket, which show minimal spatial displacements. Red and black arrows indicate the locations of IL2 and EC3/H7, respectively, the high flexibility of which is essential to substrate recognition and multimerization. The ribbon diagrams generated for a representative LeuT structure (PDB ID: 2A65) are color-coded (from blue to red) by the size and direction of motions (from negative to positive) in each mode. (b) Generic covariance map (top) and its SD (bottom), based on k ≤ 20 modes. See more details in supplementary figure S10, Supplementary Material online. Specific residue pairs whose cross-correlations significantly depart from the generic covariance are indicated by white arrows (bottom). The curve along the left ordinate shows the row-average. The peak at TM6 suggests a driving role in eliciting cooperative changes. (c) Detailed view of the global/soft motions (k ≤ 5) for 13 representative structures from 8 transporter families (labeled), in inward-facing (IF; dashed) and/or outward-facing (OF; solid) states. Differences in peaks/minima reveal member-specific features, for example, IL2 fluctuations (red arrow) are prominent in the IF states of LeuT, Mhp1, and CaiT, but not in the IF state of MhsTs, BetP, and vSGLT nor the OF states; EL3/H7 (black arrow) motions are suppressed in most IF conformers except in vSGLT, BetP, and to some extent CaiT, where this specific region facilitates trimerization (see also supplementary fig. S9d, Supplementary Material online). The curves are vertically shifted for visual clarity.

