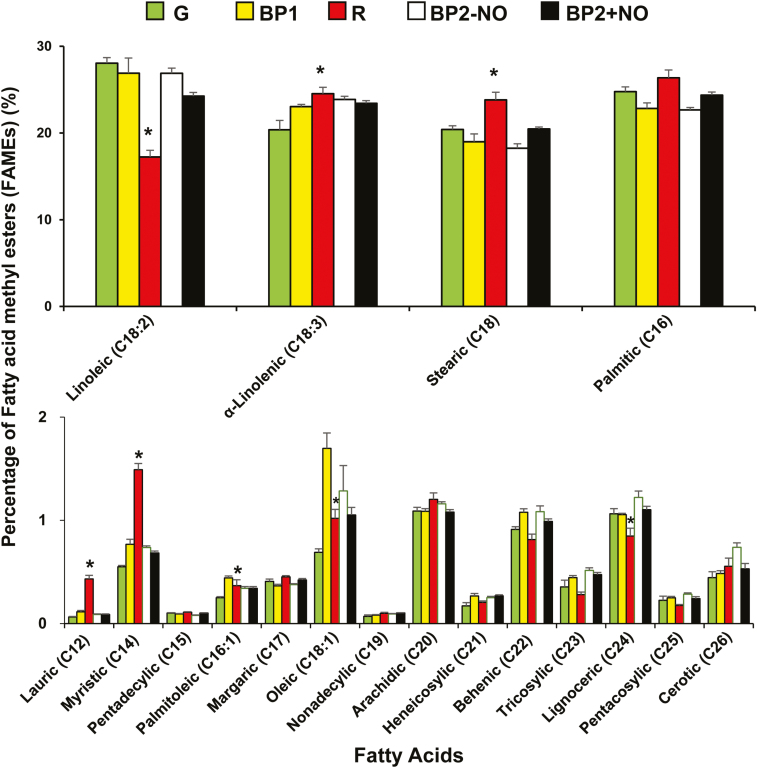
Fig. 6.
Fatty acid content and profile in sweet pepper fruits at different stages of ripening: immature green (G), breaking point 1 (BP1), breaking point 2 with and without NO treatment (BP2+NO and BP2–NO, respectively), and ripe red (R). Pairwise analysis of variance was used to detect differences in comparison to green fruits. *P<0.05. (This figure is available in colour at JXB online.)

