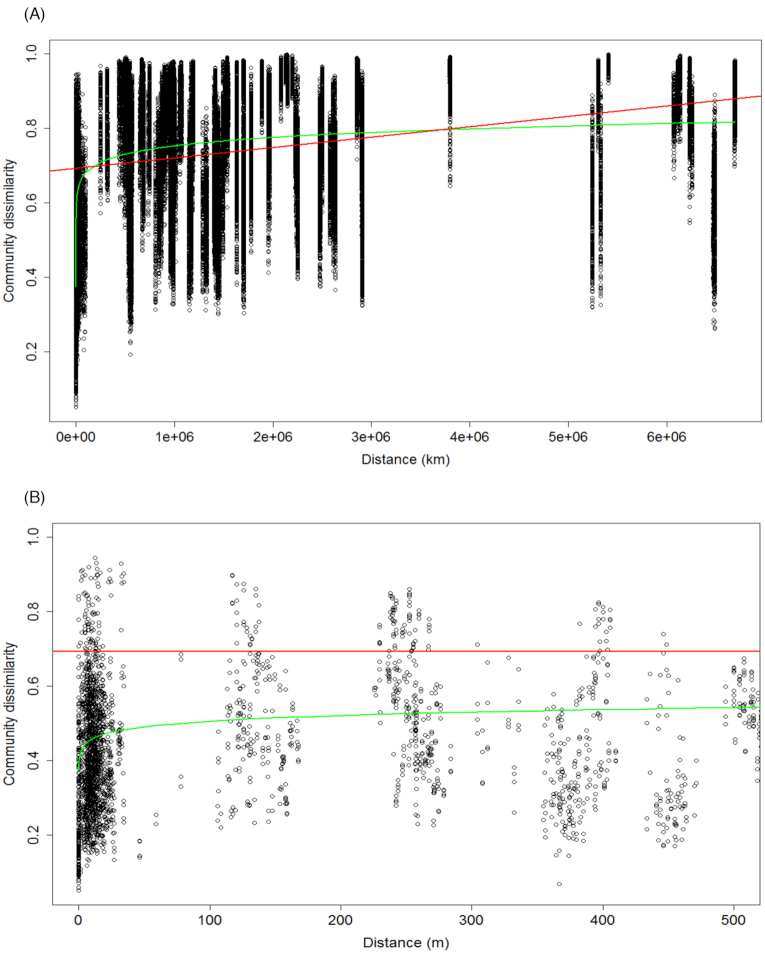
Figure 2.
Distance–decay curves with the linear regression (red), the best-fitted power model (green). (A) Community dissimilarity of the total bacterial community by geographic distance in km. (B) Zoom into Fig. 2A from 0 to 500 m to assess the spatial autocorrelation distance.

