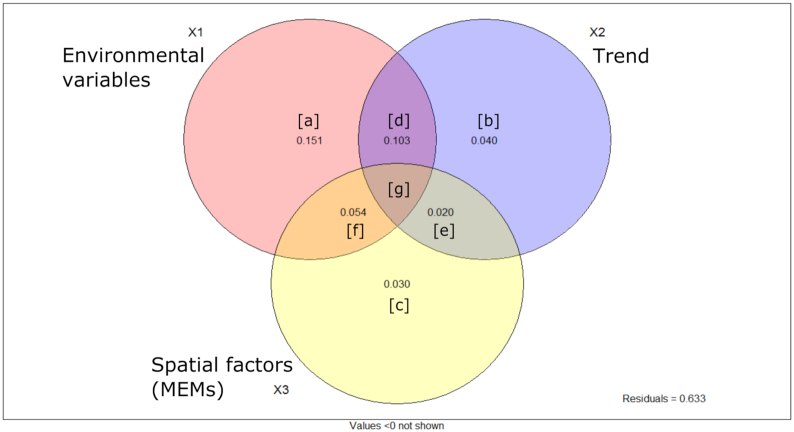
Figure 3.
Venn diagram illustrating the results of the variation partitioning analysis and indicating the amount of variation in bacterial community explained by environmental variables and spatial factors including the linear trend. Detailed results are available in Table S1 (Supporting Information).

