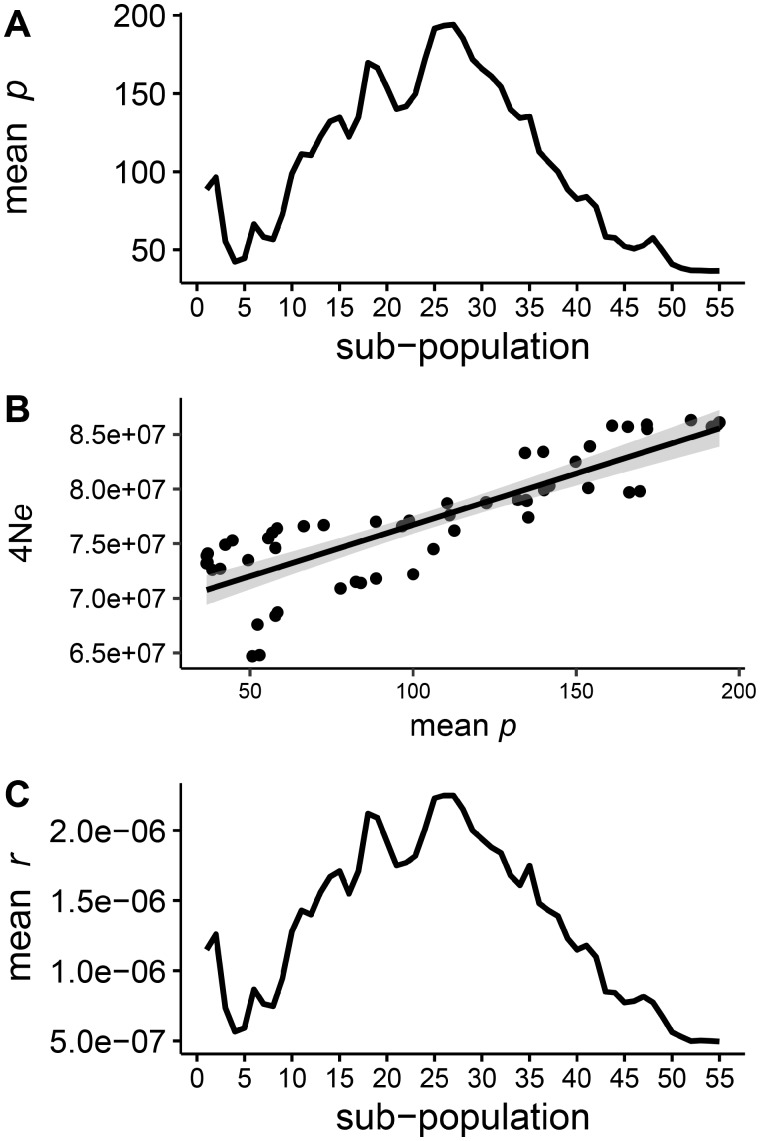
Fig. 3.
Subpopulation analysis of ρ, 4Ne, and r in geo-referenced wild barley accessions. Seventy-four geo-referenced wild barley accessions were divided into 55 sub-populations of 20 accessions per sub-population according to a sliding window approach with a step size of 1 accession. Sliding windows are moved along the geographical distribution of wild barley across the Fertile Crescent. (A) Estimation of genome-wide mean population-scaled recombination rate (ρ). (B) Correlation between effective population size (4Ne), based on estimates of Watterson’s theta (thetaW) and an assumed mutation rate (mu) of 3.5 × 10⁻⁹, and population-scaled recombination rate (ρ). (C) Genome-wide mean effective recombination rate (re) corrected for differences in effective population size.

