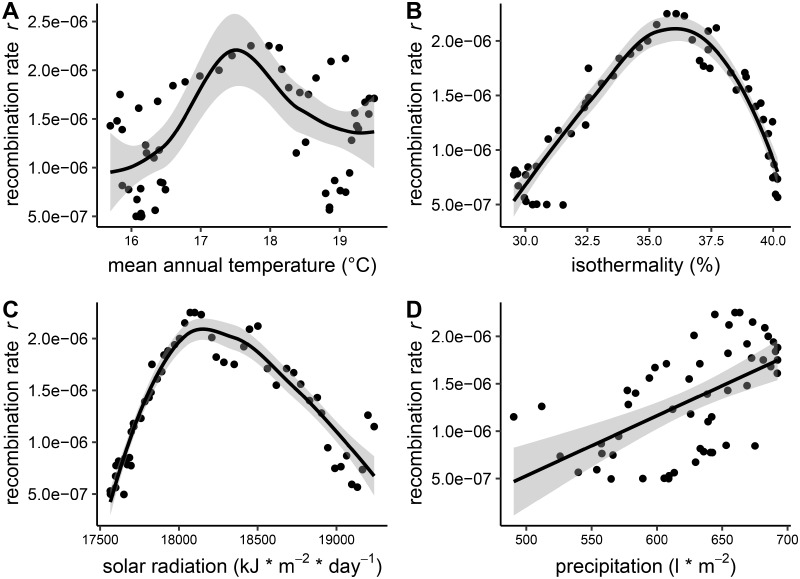
Fig. 4.
Correlation between recombination rate and environmental variables. Recombination rate estimated in 55 subpopulations of wild barley is plotted against environmental variables. The black line represents a smoothed curve over the data and the gray area represents the 95% confidence interval of the smoothed curve. (A) Relationship between recombination rate and annual mean temperature under Mid Holocene conditions. (B) Reverse U-shaped relationship between recombination rate and isothermality under Mid Holocene conditions. (C) Reverse U-shaped relationship between recombination rate and annual mean solar radiation under present conditions. (D) Correlation between recombination rate and annual precipitation under Mid Holocene conditions.

