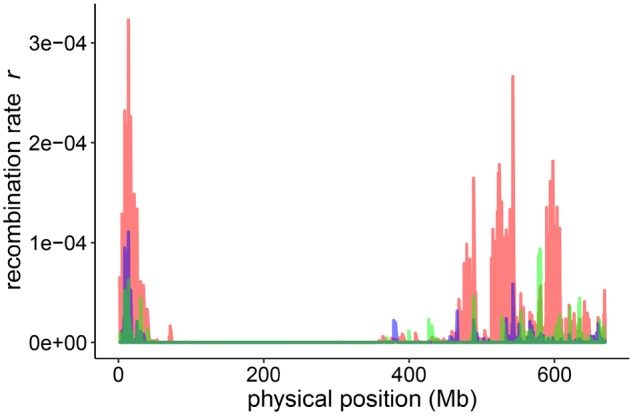
Fig. 5.

Recombination landscapes of different sub-populations. Recombination rates of different sub-populations (red = #27, blue = #4, green = #55) along the physical length of chromosome 5H. These three subpopulation were selected to represent the observed minima and maxima among all subpopulations. Variation in recombination rate is strictly confined to distal regions of the chromosome and no variation is observed in the low-recombining pericentromeric region.
