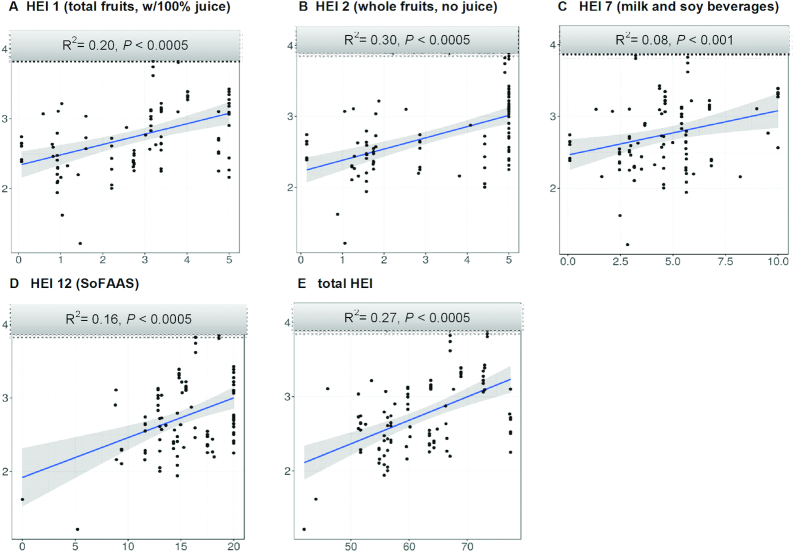
FIGURE 1.
α-Diversity of the OTUs of the colonic mucosa-associated gut bacteria based on dietary quality (panels A–E). Bacterial Shannon index (y-axis) was regressed against the score of each component and the HEI (x-axis) in a linear regression model. Each symbol represents a sample (97 biopsies from 34 participants). R2 indicates the coefficient of determination. P value was for the significance of the correlation. Only the dietary components with false discovery rate-adjusted P values <0.05 are presented. HEI, Healthy Eating Index; OTU, operational taxonomic unit; SoFAAS, calories from solid fats, alcoholic beverages, and added sugars.

