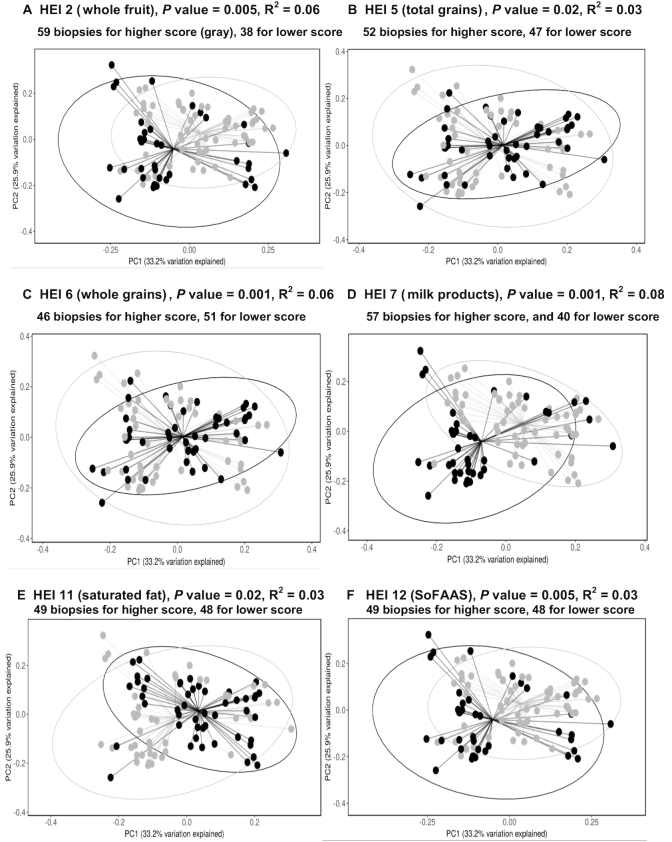
FIGURE 2.
β-Diversity of the OTUs of the colonic mucosa–associated bacterial composition based on dietary quality (panels A–F). Principal coordinate plot used the weighted UniFrac as the distance matrix. The Monte-Carlo permutation test was used to estimate P values. The lower quality group (black) was separated from the higher quality group (gray). The proportion of variance explained by the first 2 principal coordinates is denoted in the corresponding axis label. For all the panels, x-axis: PC1 (33.2% variation explained); y-axis: PC2 (25.9% variation explained). HEI, Healthy Eating Index; OTU, operational taxonomic unit; PC, principal coordinate; SoFAAS, calories from solid fats, alcoholic beverages, and added sugars.

