FIGURE 1.
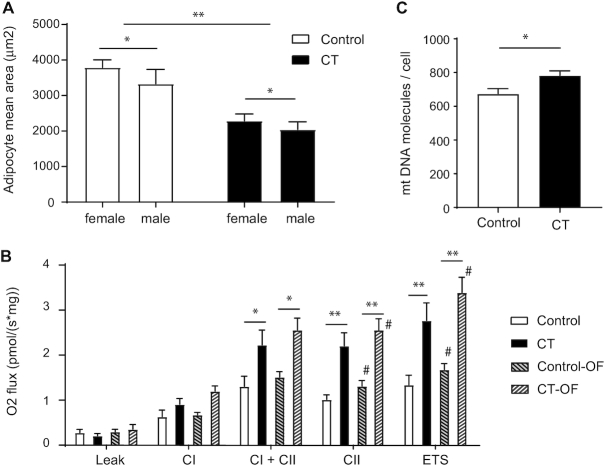
Distinct differences in adipose tissue in constitutional thinness (CT). (A) Adipocyte area (μm2) measured by histological analysis. Values are expressed as mean and SEM. Mean values are from at least 10 pictures per slide (capturing more than 1000 cells per sample). Black bars correspond to CT individuals ( n = 29, 15 females and 14 males), while white bars correspond to the controls (n = 29, 15 females and 14 males). (B) Respirometry analyses in subcutaneous white adipose tissue (sWAT) using high-resolution respirometry. Values are expressed as mean and SEM from 10 CT individuals (5 females, 5 males; black bars) and 13 controls (9 females, 4 males; white bars) before and after overfeeding (OF; dashed bars). CI, complex I respiration; CI + CII, complex I and II respiration; CII, complex II activity alone; ETS, maximal electron transport system capacity. (C) Mitochondrial DNA content in sWAT at baseline in CT individuals ( n = 29) compared with controls (n = 29). Associations between CT status and variables were tested using a logistic regression adjusted on confounders (age and sex) at baseline and after intervention. Statistical significance level after correction for multiple testing when comparing CT versus controls is indicated by * for P < 0.05 and ** for P < 0.01, while # indicates a significance level at P < 0.05 of the intervention (before vs after intervention).

