
Figure 1.
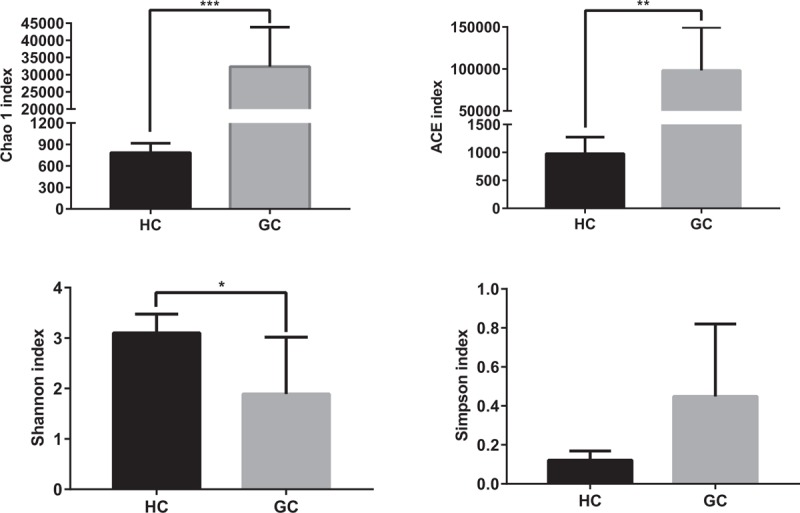
Richness and diversity of gut microbiota between GC patients and HCs. Richness and diversity calculated using phylotype relative abundance measurements between groups at the genus level. ∗ indicates P < .05 when compared with the HCs group. ∗∗ indicates P < .01. ∗∗∗ indicates P < .001. GC = gastric cancer patients group, HC = healthy controls group.