
Figure 2.
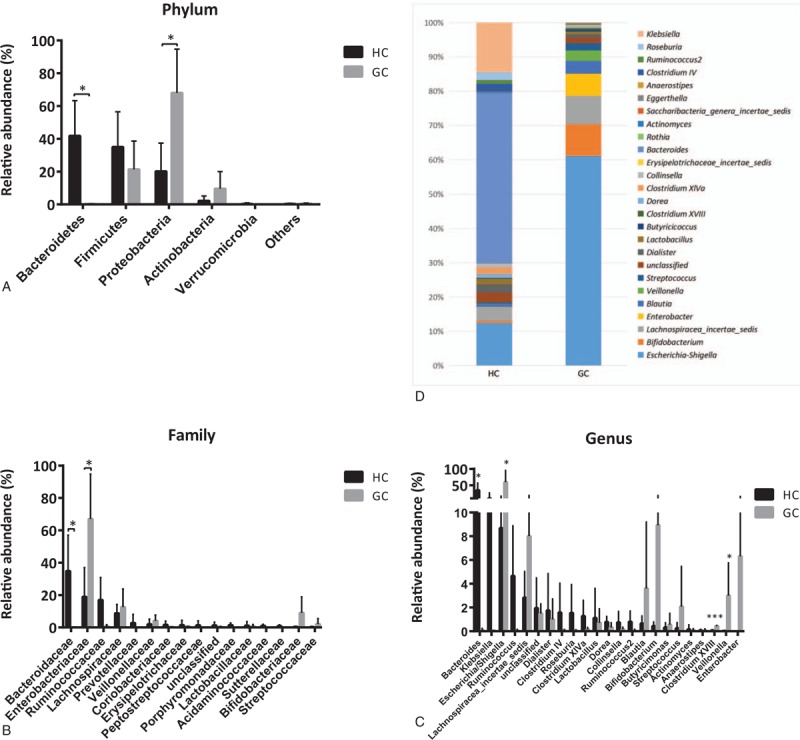
Comparision of gut microbiota between GC patients and HCs. Relative abundance of the compositional difference of dominant bacteria in GC patients and HCs at the phylum (A), family (B), and genus (C and D) level. ∗ indicates P < .05 when compared with the normal group. ∗∗ indicates P < .01. ∗∗∗ indicates P < .001. GC = gastric cancer patients group, HC = healthy controls group.