
Figure 3.
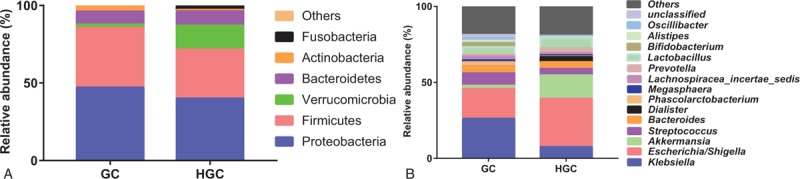
The composition of gut microbiota between GC group and HGC group. Bacterial relative abundance at the phylum (A), genus (B) level for HC group and GC group. GC = preoperative samples form GC patients, HGC = postoperative samples from GC patients.