
Figure 4.
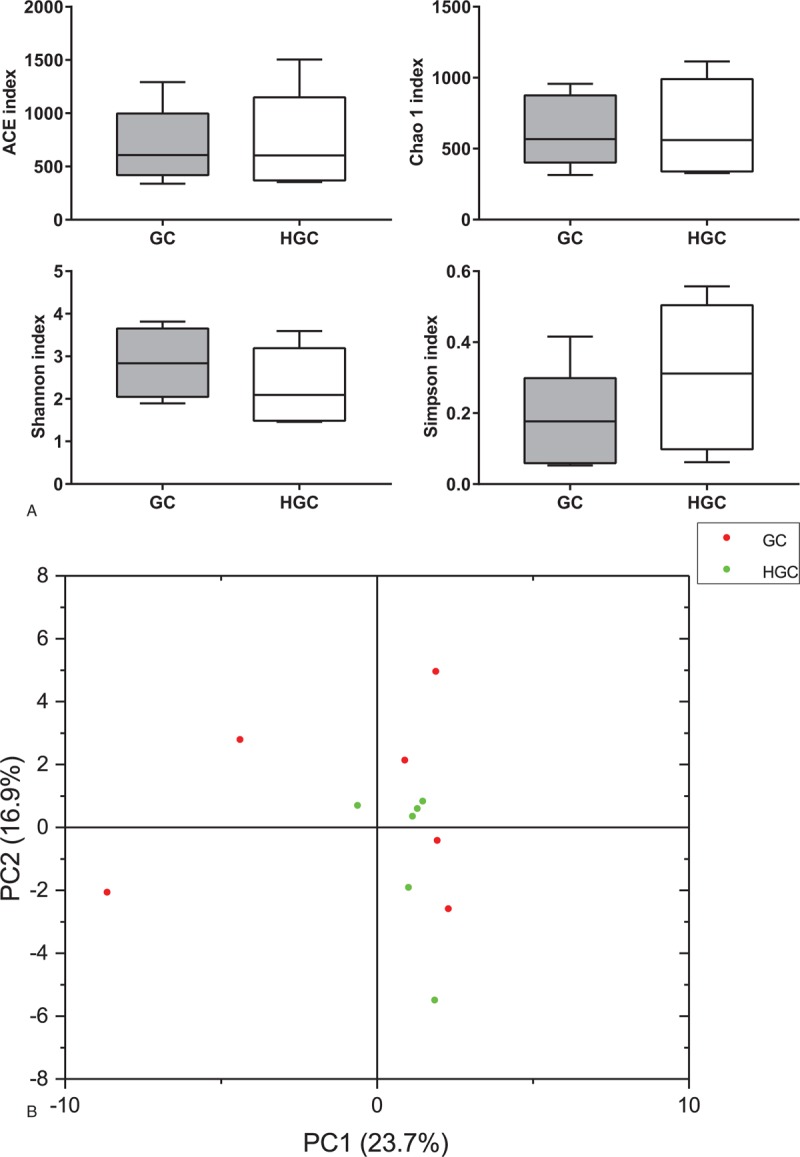
Overall difference in gut microbiota between GC group and HGC group. Box-plots of alpha diversity, and the line inside the box-plot indicates the median. Lines above and below the box represent the 10th and 90th percentiles, respectively (A); PCA of unweighted UniFrac distance as a measure of beta diversity across smples. Each point represents 1 sample. Samples in the same group are labeled the same color. The red dots and green dots denote samples from GC group and HGC group, respectively (B). GC = preoperative samples form GC patients, HGC = postoperative samples from GC patients.