
Figure 5.
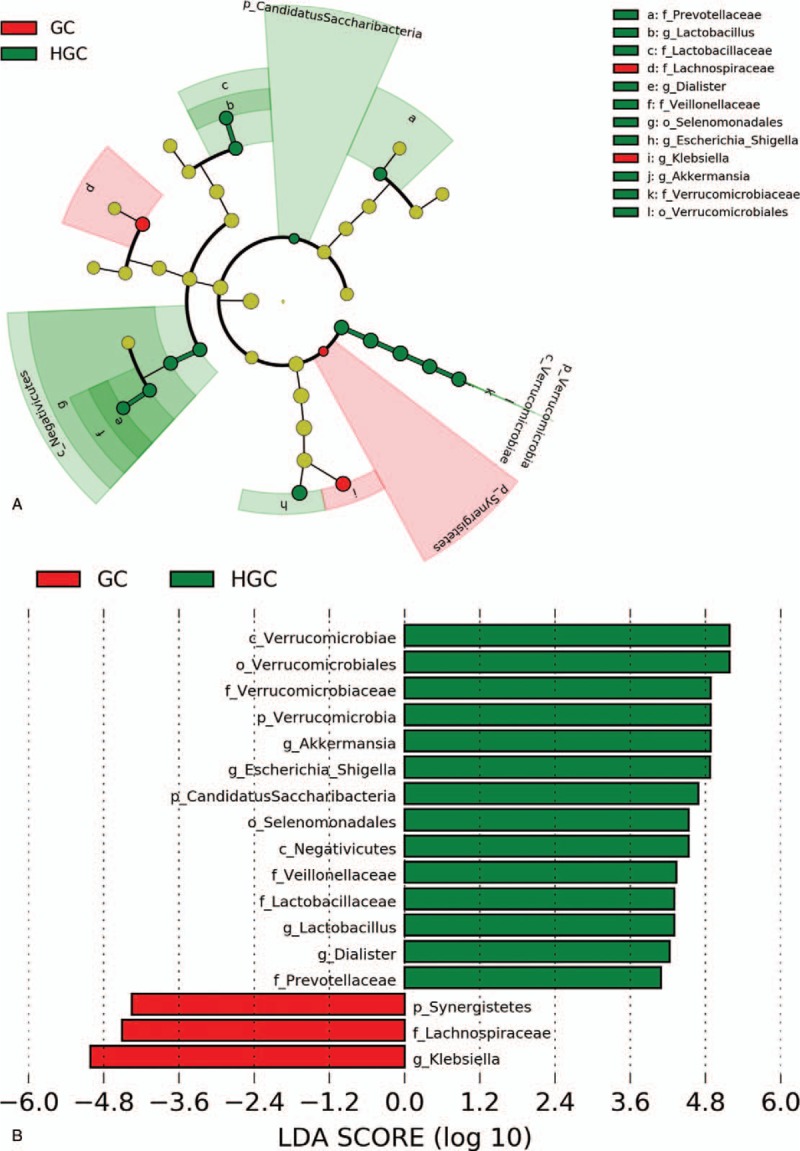
LEfSe analysis of enriched bacterial taxa in gut microbiota between GC group and HGC group. LEfSe-derived taxonomic cladogram (A); LDA score of enriched bacterial taxa (LDA >3.5 of LEfSe). Significantly enriched bacterial taxa in fecal samples from GC group and HGC group are indicated by different colors. Red bars indicate taxa enriched GC group, and green bars indicate taxa enriched HGC group (B). GC = preoperative samples form GC patients, HGC = postoperative samples from GC patients, LDA = linear discriminant analysis.