
Figure 6.
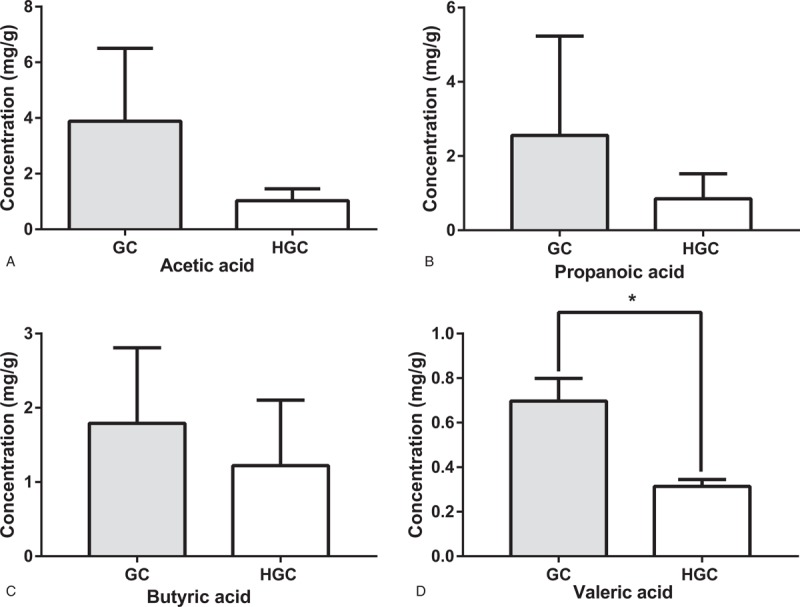
Comparision of fecal SCFA between GC group and HGC group. Concentration of fecal SCFAs, acetic acid (A), propionic acid (B), butyric acid (C) and valeric acid (D) for GC group and HGC group. ∗ indicates P < .05 when compared with the GC group. GC = preoperative samples form GC patients, HGC = postoperative samples from GC patients, SCFA = Short-chain fatty acid.