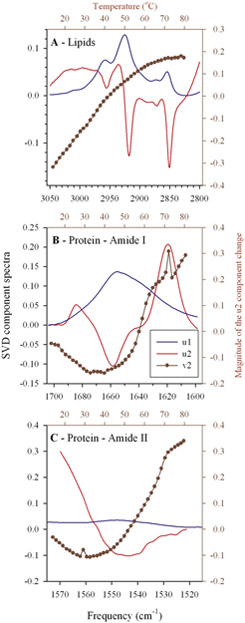
Figure 8.
Typical examples (from WT25thylakoids) for the result of the multivariant Singular Value Decomposition (SVD) analysis of u1 (the ‘average’) in blue, the u2 (the ‘largest change’) in red, and the amplitudes (v2 vectors) of the u2 components in dark red for the CH stretching. The analyzed regions of the infrared spectra were: Lipids – (3050-2800 cm−1), Amide I – (1700-1600 cm−1), and Amide II – (1575-1515 cm−1). Bottom and left axes correspond to u1 and u2 spectra, top and right axes to the v2 amplitudes. For details, see the text.

