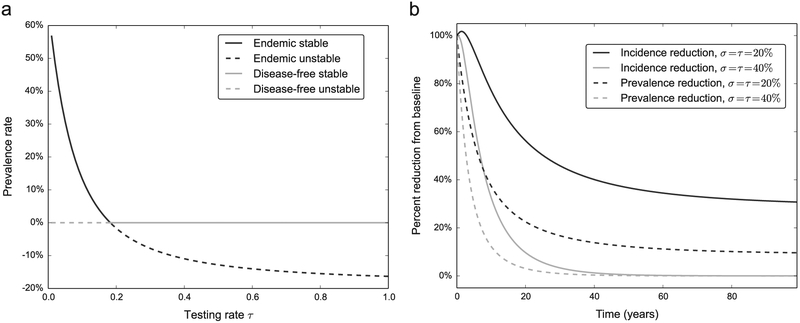
Fig. 5.
Solutions on both sides of the endemic threshold. (a) Bifurcation diagram showing the exchange of stability between the disease-free equilibrium and the endemic equilibrium when undergoing a transcritical bifurcation. The treatment rate parameter is fixed at σ = 0.4 on these curves for a varying testing rate. (b) Change in incident cases and prevalence rate with τ and σ in both sides of the endemic equilibrium (dark lines are endemic stable, gray lines are disease-free stable). As expected, both the number of incident cases and the prevalence rate drop to zero in the disease-free scenario (gray lines), and remain above zero.

