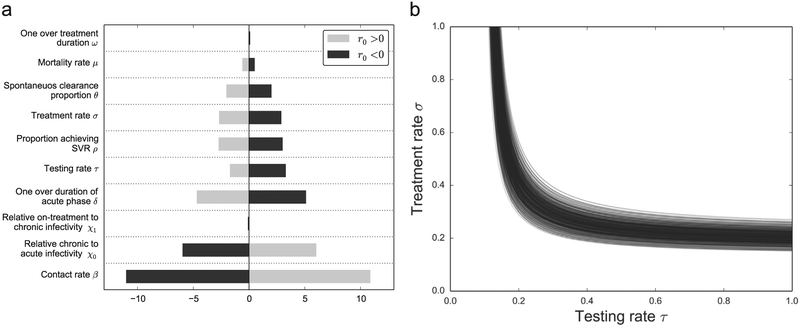
Fig. 6.
Sensitivity analysis when determining r0. (a) The sensitivity parameter when calculating r0 (Eq. (4)) with model parameters for both a stable and unstable disease-free equilibrium. (b) We performed 500 runs calculating the stability threshold r0 = 0 on the (τ, σ) parameter space using Latin hypercube sampling on the parameter ranges from Table 1.

