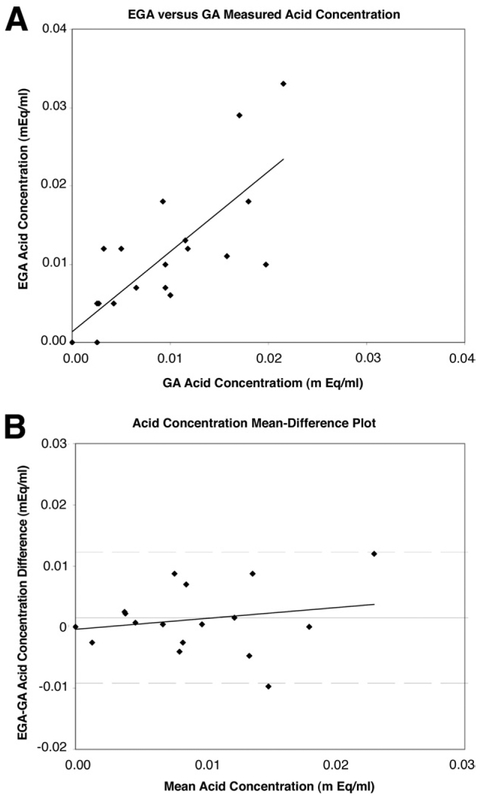
Figure 2.
(A) Plot of EGA-measured AC against GA-measured AC with least-squares regression analysis. (B) Bland–Altman plot assessing agreement between EGA and GA AC with least-squares regression analysis. The mean difference (horizontal solid line) is plotted along with the 95% limits of agreement (dashed lines).

