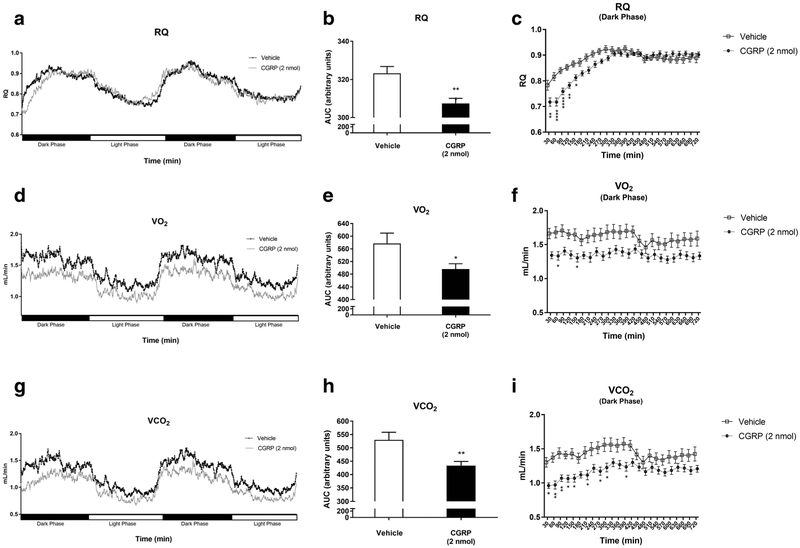
Fig. 2.
Analysis of respirometry and calorimetry data in WT mice IP injected with CGRP 2 nmol (n = 16) (black) or saline (n = 16) (white). A 48-h analysis of RQ (a) was conducted by calculating the total area under the curve for the dark phase (b) that was also subdivided in 30-min intervals (c) in CGRP and vehicle-injected mice. A 48-h analysis of VO2 (d) was conducted by calculating the total area under the curve for the dark phase (e) that was also subdivided in 30-min intervals (f) in CGRP and vehicle-injected mice. A 48-h analysis of VCO2 (g) was conducted by calculating the total area under the curve for the dark phase (h) that was also subdivided in 30-min intervals (i) in CGRP and vehicle-injected mice. Data are expressed as mean ± SEM. *p < 0.05, **p < 0.01, ***p < 0.001, ****p < 0.0001

