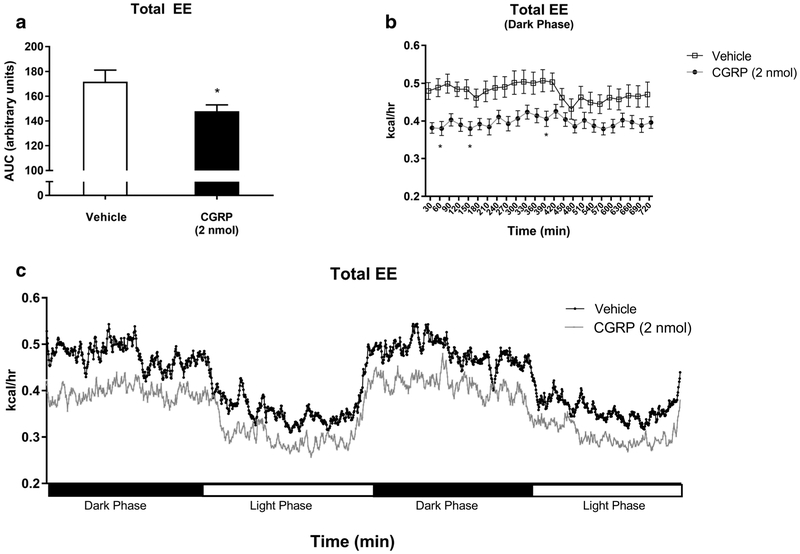
Fig. 4.
An analysis of total energy expenditure (TEE) was conducted in WT mice IP injected with CGRP 2 nmol (n =16) (black) or saline (n = 16) (white) by calculating for the dark phase: the total area under the curve (a), 30-min time intervals (b), and 48-h TEE (c). Data showed a significant reduction in TEE in CGRP-treated mice as compared to control. Data are expressed as mean ± SEM. *p < 0.05

