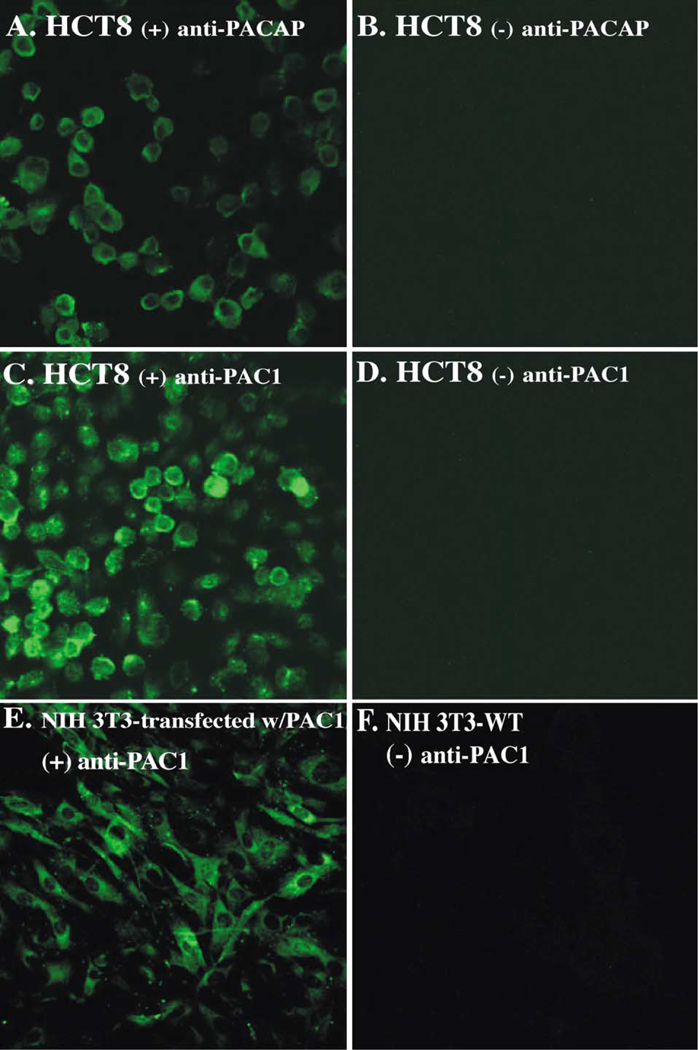
Fig. 2.

Confocal analysis. Confocal images show the expression of PACAP (panel A) and PAC1 (panel C) in HCT8 cells. Anti-PACAP or anti-PAC1 rabbit polyclonal Abs, followed by Alexa-488-conjugated goat anti-rabbit IgG, were used. In panels B and D, cells were incubated with rabbit IgG, followed by Alexa-488-conjugated goat anti-rabbit IgG. PAC1-transfected NIH-3T3 cells (panel E) and untransfected NIH-3T3 (panel F) were used as PAC1 positive and negative controls, respectively.
