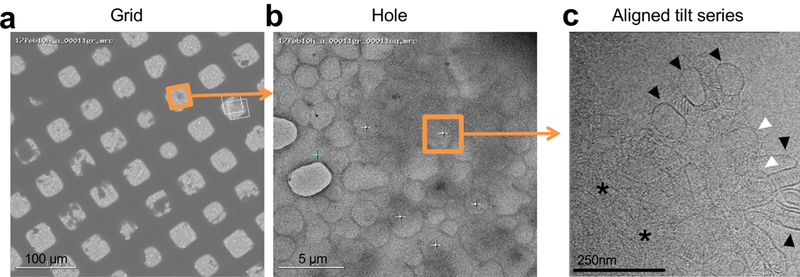
Extended Data Figure 6: Data collection strategy for assessing protein assemblies formed by clustered protocadherins between liposomes.

a, Grid-view of protein-liposome aggregates (dark shadows) deposited on lacey carbon grids, 300 copper mesh.
b, Hole-view of the boxed area shown in a. Protein-liposome aggregates can be seen as dark shadows. Tilt-series collection of liposome aggregates over lacey carbon holes in thin ice (orange square). White crosses represent other data collection sites, cyan cross represents focus target.
c, Tilt image collected at the region highlighted in b. A single layer of liposomes coated in protocadherin density (black arrow head), liposomes stacked on top of each other (white arrow head), and, in addition, thick layers of stacked liposomes (asterisk) are visible in the image. Note that membranes at liposome contact sites appear parallel, and Pcdh density appears to be ordered. See Supplementary Video 2 for the reconstructed tomogram.
