
Extended Data Figure 7: Pcdh zippers from the γB4EC1–6 crystal structure match the ordered linear arrays observed for γB6EC1–6 on membranes.
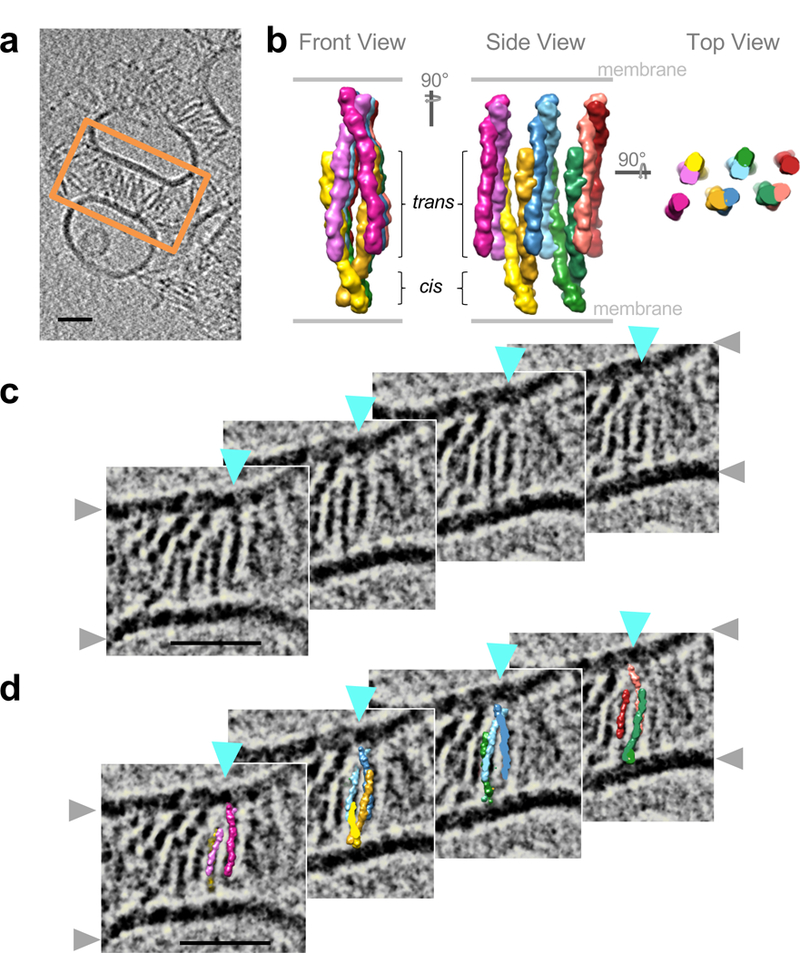
a, Tomographic slice through a reconstructed tomogram of adherent γB6EC1–6-coated liposomes. Region of tomographic slices shown as close-up views in c and d is highlighted by an orange box.
b, Molecular surface views of the γB4EC1–6 crystal lattice arrangement in three orientations. Each protomer is colored in a different color.
c, Tomographic slices spanning 143 Å into the depth of the tomogram, one linear array progressing into the plane of the tomogram is indicated by cyan arrow heads. Grey arrowheads indicate lipid bilayers.
d, Crystallographic γB4EC1–6 zipper fitted consisting of five consecutive cis dimers into the cryo-ET density of the marked γB6EC1–6 array (cyan arrow heads) observed between membranes. Compare density and structure fit between panels in c and d. Protomers colored as in b.Scale bars: 350 Å