
Extended Data Figure 3: Particle selection and subtomogram averaging of Pcdh γB6 complexes in solution.
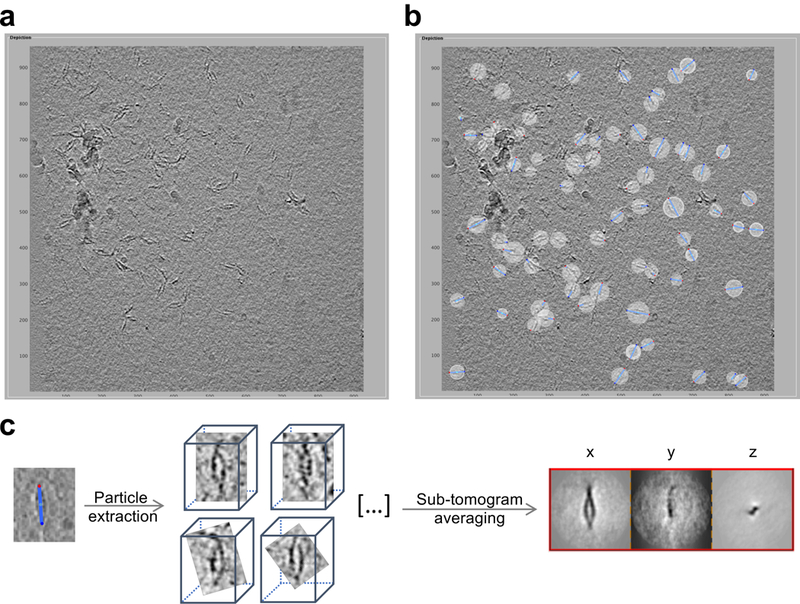
a, Representative tomographic slice showing orientation of γB6EC1–6 complexes in vitreous ice. Note that ‘front views’ are predominant, and represent a preferred orientation. Scale indicates nm.
b, Complexes in the ice are selected as dipole sets (blue sticks). For each particle ‘north’, ‘center’ and ‘south’ points are marked as blue, cyan and red spheres, respectively. Scale indicates nm.
c, Sub-volumes of pre-oriented particles were extracted from tomograms, sub-tomogram averaging converged and projections of last iteration are shown on the right.