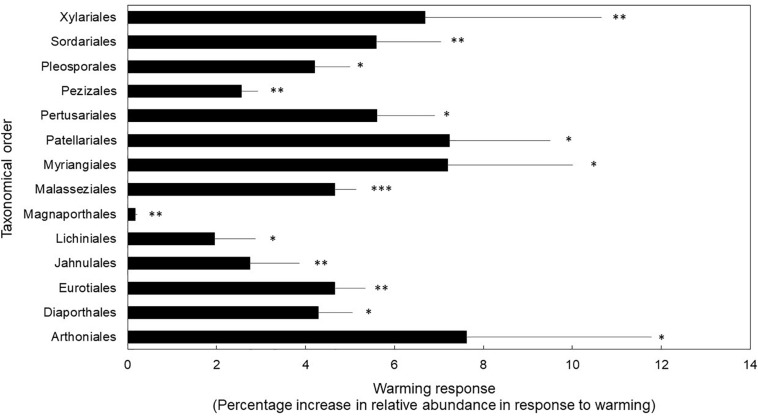
FIGURE 2.
Fungal orders that displayed significantly different warming treatment response as percentage increase in relative abundance in response to warming. Bars are means ± 1SE of n = 4. ∗P < 0.05, ∗∗P < 0.01, ∗∗∗P < 0.001. Transcript counts and relative abundance of all orders in this study are reported in Supplementary Table S3.

