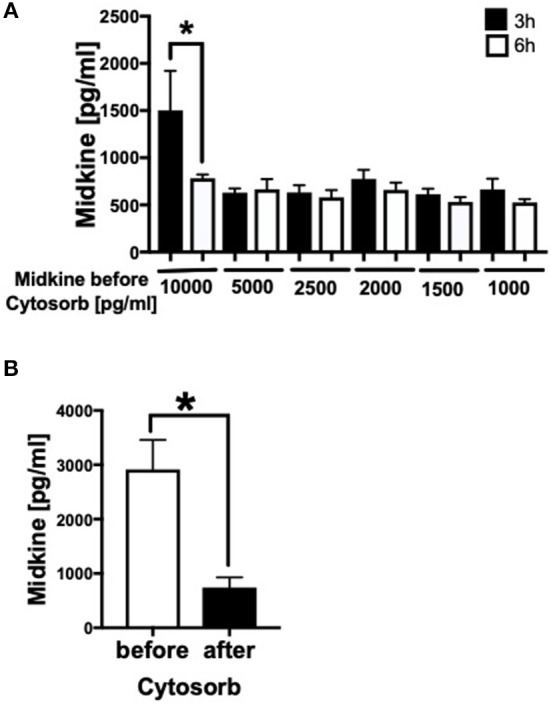
Figure 6.

Filtration of Midkine by CytoSorb® 300. Filtration of different Midkine concentrations (10,000, 5,000, 2,500, 2,000, 1,500, 1,000 pg/ml) (n = 6) with CytoSorb® 300 after 3 h (black bars) and 6 h (white bars) (A). Midkine concentration before and after filtration with CytoSorb® 300 on the x-axis in pg/ml. Midkine levels (pg/ml) in human shock room blood plasma of multiply injured patients before and after filtration with CytoSorb® 300 (n = 11) (B). Results are presented as mean ± SEM. Data were analyzed by one-way ANOVA followed by Dunnett's or Tukey's multiple comparison test. Results are significant *p < 0.05.
