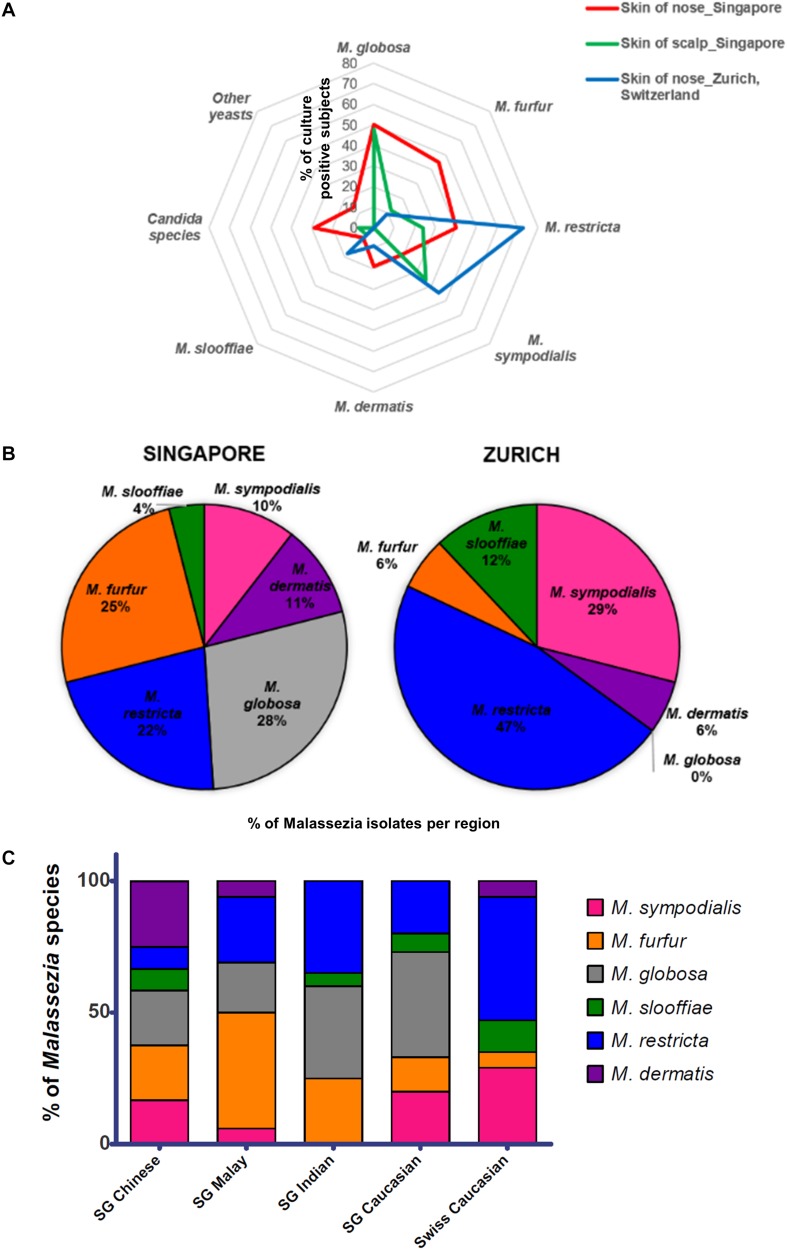
FIGURE 1.
(A) Radar plot of percentage of subjects that were culture positive for each species (y-axis) as sampled from the respective cohorts and body sites, (B) pie charts showing percentage of each Malassezia species isolated from the skin of the nose calculated as a percentage of total Malassezia isolates from each respective cohort, and (C) Malassezia species isolated from the skin of nose of Singapore (n = 37, 10 Chinese, 7 Malay, 10 Indian, and 10 Caucasian, equal gender) and Swiss (n = 11) cohort subjects, represented as a percentage of the total Malassezia species isolated from each ethnic group.

